As Monday mornings go, starting work today to the background of multiple sugary snacks, inspirational leadership speeches and gatherings of digital experts from across the world was quite a good one. It’s Discovery Week here at the Guardian, and we’ve just finished day one of our process to look at “the next phase of the Guardian’s digital future”.
The plan for the week is for the various teams and departments within the Guardian to collaborate and build a wide variety of projects and then demo them across the organisation at the end of the process. There are five themes for the week: Content Journeys, Visual Design, Social, Live and Commercial. Teams from Google, Mozilla, and the Guardian’s US office have travelled to work on one or more project within these themes.
Nobody is completely certain about what the outcomes of the week will be: while there’s a hefty spreadsheet knocking around which lists everyone’s ideas and team members, it’s an open opportunity to explore new concepts and think and iterate through ideas about where the Guardian could go in the future. The best ideas will be taken forward and explored in-depth.
For me, day one of Discovery Week has been off to a fairly exciting start. I’d been away on holiday for the previous two weeks so was a little flustered upon arriving into the office to find it transformed into a baked goods-laden workspace with posters and boards advertising each of the five different working areas.
My own project team had the foresight to meet up before I got back meaning I could slot fairly effortlessly into place alongside them at what we’re codenaming “PROJECT LASERWOLF” (capitals are mandatory), but more usefully, “Relative Importance”. The aim of this project is to produce a system which Guardian editors can use to indicate the importance of a set of given news stories against a global ranking (for example, a story worth 1 point might be “A cat was found stuck up a tree in Croydon”, whereas a 100 point story might be “A terrorist attack has been committed during the London 2012 Olympics”). We can then use this spread of data to help us figure out how to lay out and prioritise articles automatically across all of our different platforms (eg. mobile, desktop, tablet, mobile apps, Kindle, Facebook, and any future devices we might develop for).
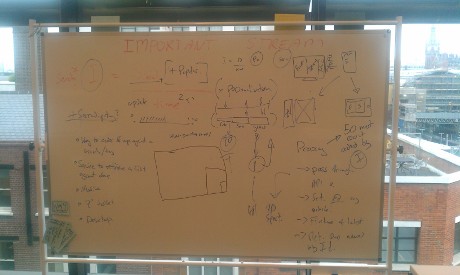
At the end of day one we’ve got some early prototype hacks and a whole whiteboard full of confusing lines and algorithms. We’re wondering how it would work to tie in external factors (social media shares, page impressions, bounce rate, etc) into the importance weighting our editors attach to articles, and we’re currently locked in an epic battle of wills about whether we rank things on a scale of 1-10 or 1-100, and how we factor in automated decay of older stories with high weightings. I’m sure the attached photo of our work-in-progress whiteboard will make everything clear.