
One area that’s been grabbing the Quality Assurance team’s attention recently is data. The entire organisation relies heavily on data. Take our journalism - while it’s not data-driven, its heavily “data-informed”. We’ve developed our in-house real time tracking tool, Ophan, to understand the reach of our journalism and the breadth of experiences our readers have reading it. Our software development teams also rely on data, using Adobe Omniture to store long-term data and short-lived things like A/B test results.
Data is also part of the QA team’s workflow, but historically less so than other teams. Because the historical mission of QA was testing, data was mostly used to assess the impact of a bug. Moving away from testing warrants a change in our relationship with data and opens up the possibility for radical ways of thinking. What if the best move for our product is not to fix a bug in a feature, but to discontinue the feature altogether?
To make way for data-driven quality, we first need to make sense of data. But data is hard. People need to be trained just to query a database to get at the data. And once that’s out of the way, the sheer volume of data available can quickly become overwhelming. If you want people to pay attention to data (and we do) you have to make it easy for them to do so.
As a first step to tackle this, we set out to build an online dashboard - essentially a web page to answer questions about our users and provide key metrics on the quality of our products.
How do you do it?
The first step in making a custom dashboard is getting our hands on some data. Which in practice means deciding which questions are most important and finding the answers. We settled for characterising our user base and found that Adobe Omniture has both the analytics data we need and an API available to query it programmatically. After playing around with it for a while, we quickly understood a couple of things.
First, data visualisation is absolutely key to making it useful and easy to understand. We tried a few solutions but found that the Highcharts Javascript library produces gorgeous HTML5 charts and has a plethora of chart types available that were great for our purpose.
Secondly, we realised that the queries we use to characterise our user base span months of analytics data. The data-stream is not real-time but historical and therefore the queries take several minutes to complete. We wanted our webpage to load instantly, so some form of caching would be needed.
To tie both these requirements together, we used node.js and the nomniture library to render our dashboard as a static webpage. Using Javascript for both front and back-end reduces the complexity of the project, but it also makes it easier for people in the teams without programming experience to contribute to the project.
The final step to make the dashboard a reality is to understand how to build and publish a static webpage. We wanted immediate availability without compromising security. As most of the Guardian’s infrastructure relies on AWS, we opted to run our node.js code as a nightly lambda function that uploads the dashboard to a private S3 bucket. A simple and integrated solution to handle a static webpage!
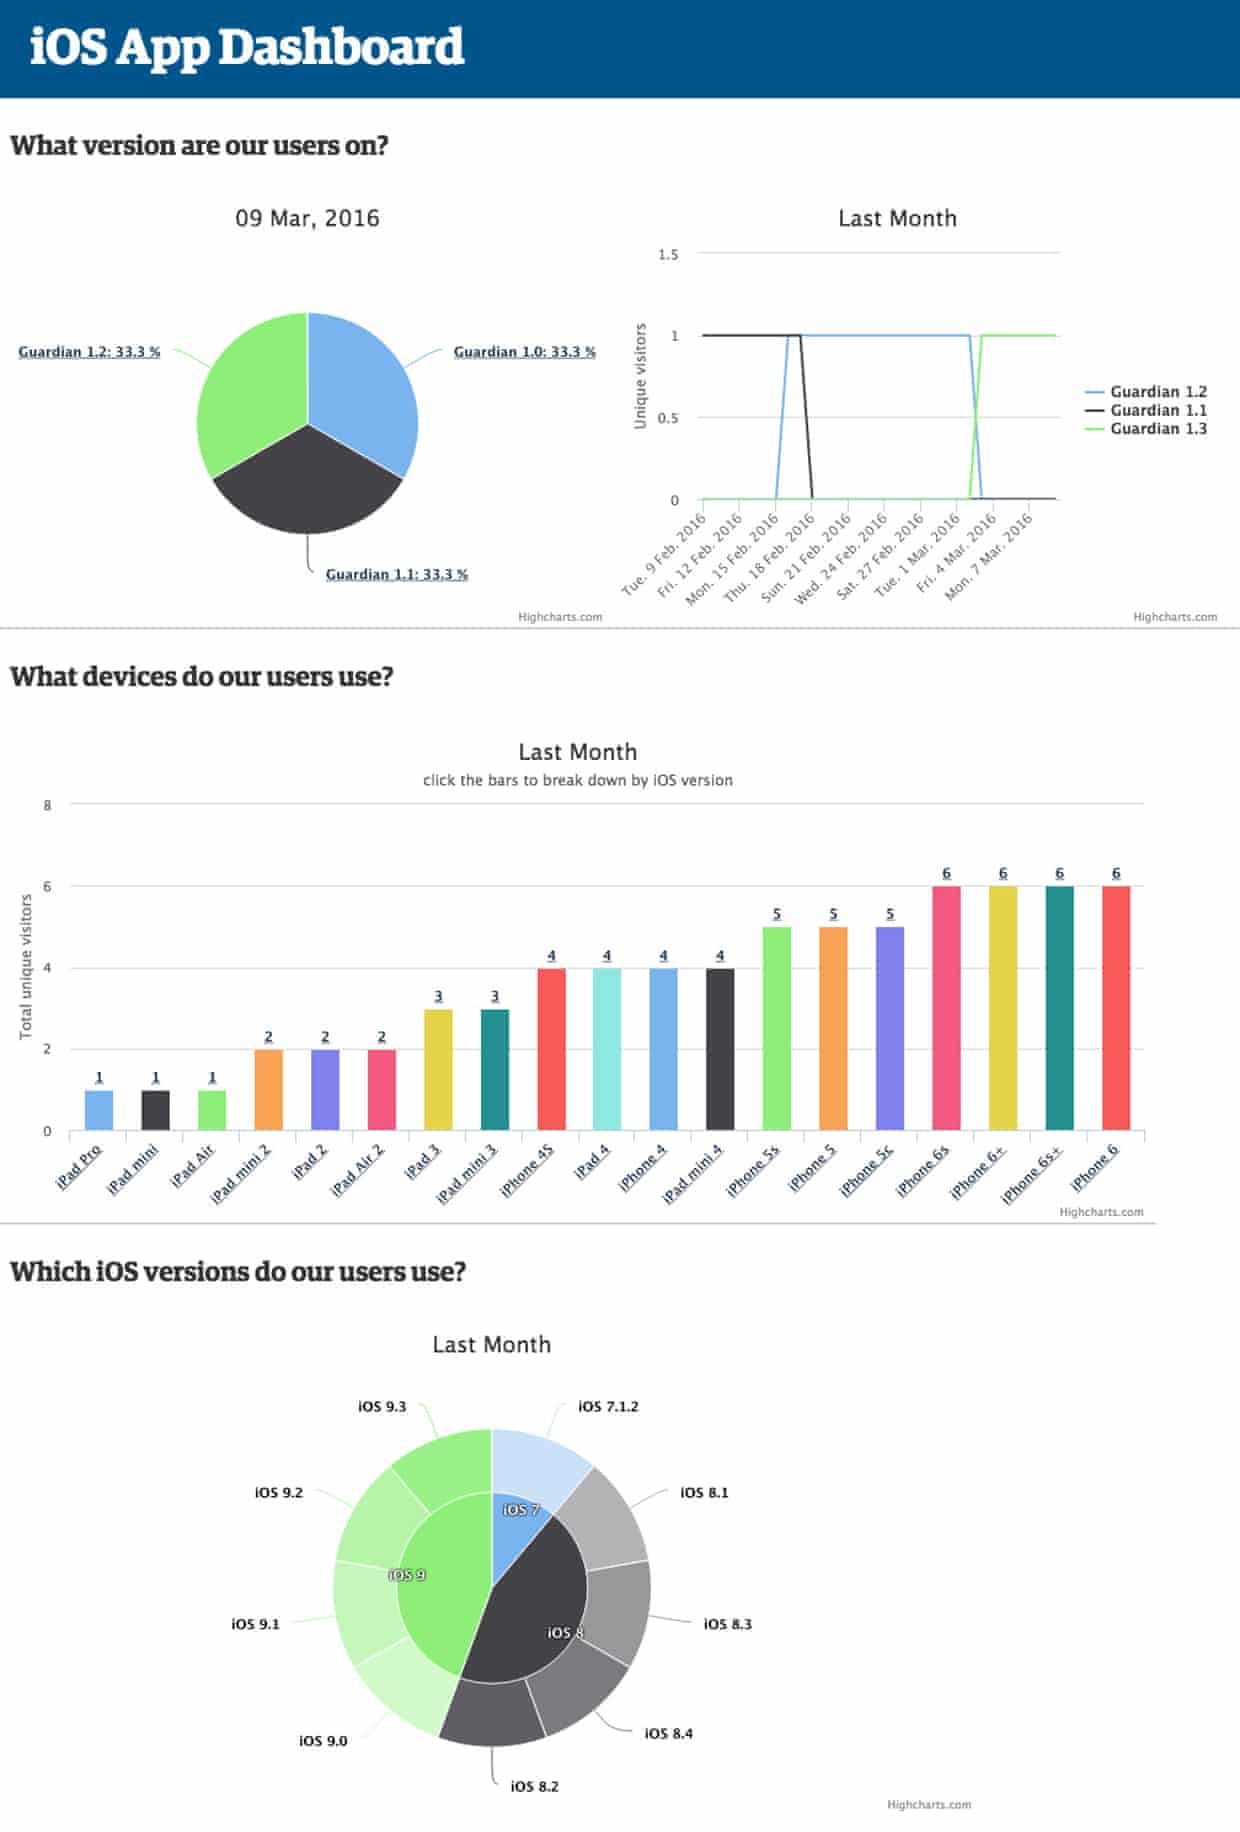
In a first iteration, we put together a simple dashboard for the iOS app team that answers a few common questions, such as how popular a device or an iOS version is with our user base.
What’s next?
We set out to make our approach to QA more data driven, by making data easier to read and easily accessible to people in the teams. With the dashboard we’ve put together, we believe we’ve taken a step in the right direction. Along the way, members of the QA team also had the opportunity to learn Javascript and how to interact with APIs.
The project is available under a free software license at https://github.com/guardian/omniture-dashboard. Contributions are welcome!
We’re hiring!
If you have a passion for product and software quality, and the above sounds like the kind of development you would like to be involved in, we are currently hiring for a new Software Engineer - tools, process & automation. You can apply here.