
For the past few months, several Commercial Development team members, and data scientists at the Guardian have been working on a side project we call “Project Maguire.”
Maguire is an attempt to answer a simple request: “Show me the money!”
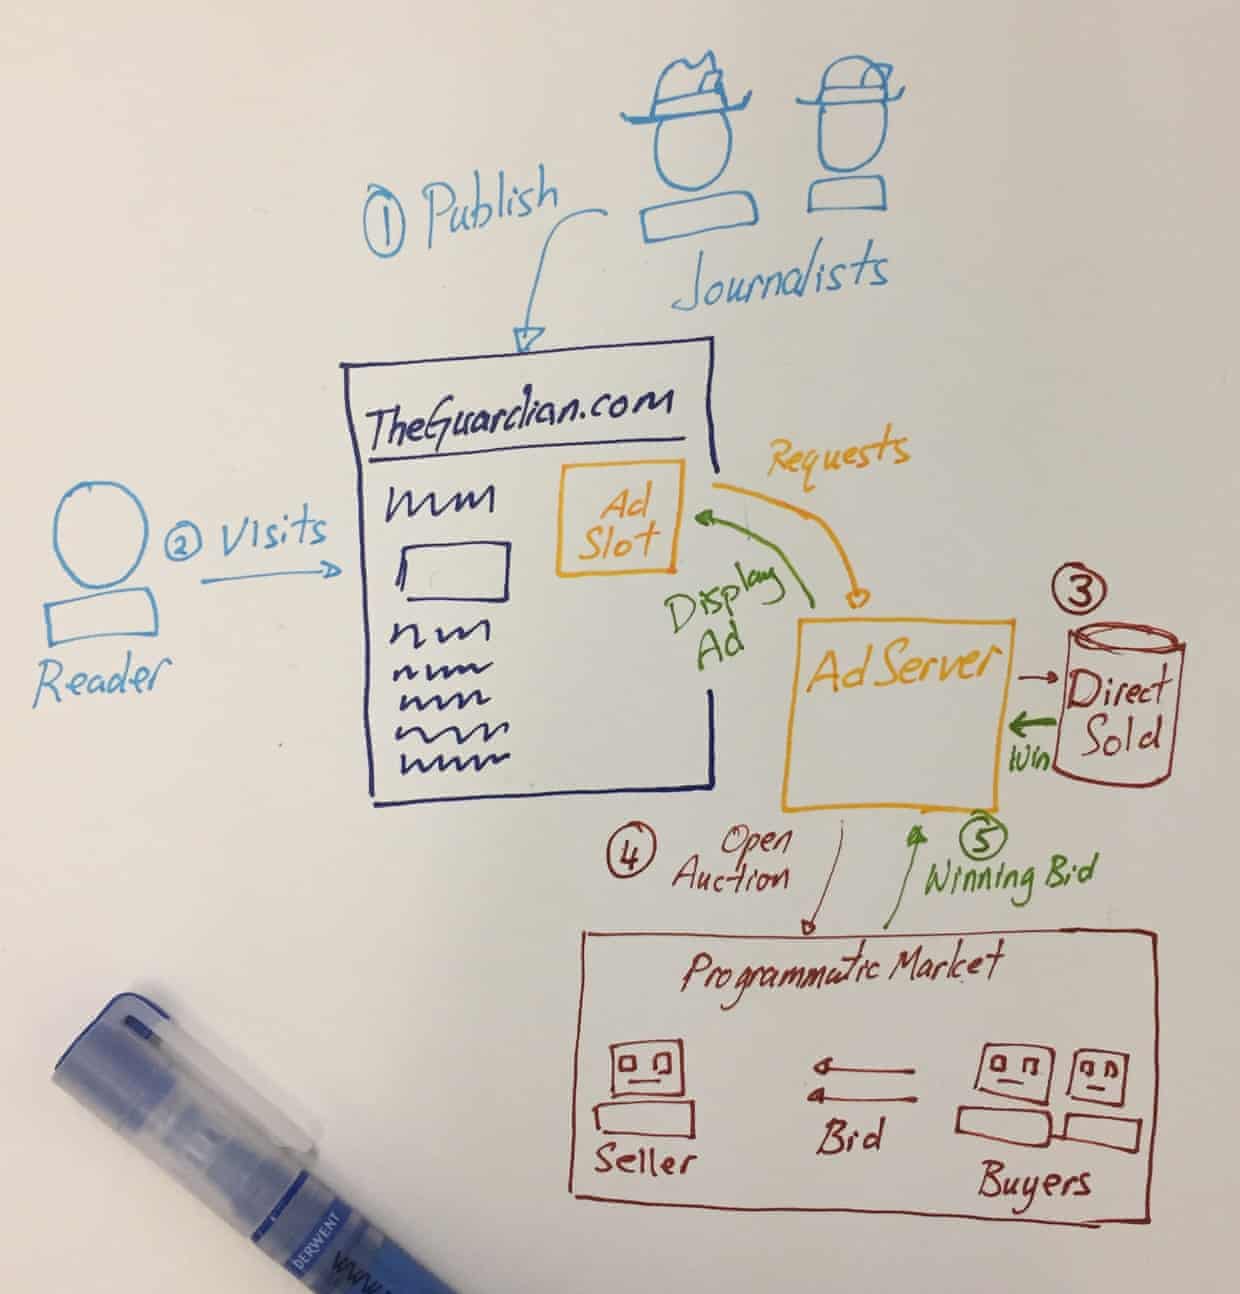
So this is how TheGuardian.com makes money:
-
The Editorial Department of the Guardian produces quality liberal journalism. This journalism attracts the attention of about 10 million unique readers per day.
-
For every page a reader views (a “pageview”), the strategically placed ad slots ask our ad server for ads to display to the reader.
-
The ad server first looks through our store of ads that our commercial sales team sold to advertisers (“direct sell” ads). If there aren’t any to show, we open up the ad impression to an open auction.
-
As these auctions have to be completed in milliseconds, the selling and buying process is entirely left to computer programmes that have been setup with the right criteria to sell and to buy. This is the “programmatic marketplace”.
-
The winning bid will then deliver its ads to the ad slot on the page. At the end of the month, the Guardian gets a cheque from the marketplace.
The performance of theGuardian.com in serving our readers is measured by Ophan: a bespoke metrics system conceived at a Hack Day in 2012.
The financial performance of theGuardian.com is measured by retrieving reports from our programmatic marketplace accounts, and by financial reports from our sales system. It’s not as sexy as Ophan.
However, there really wasn’t a way to tie the performance of the site to the actual revenue we were generating.
And so to answer this, we started this little project. It felt appropriate to name it after the 1996 movie, “Jerry Maguire”, in which Tom Cruise had to yell “Show me the money!” several times in order to get things done.
“I feel the need… the need for speed.”
Ideally, we would track our ad performance by tagging each and every ad with an identifier and matching the logs for each ad against each individual user and the page they were looking at.
This is an insane amount of work, and is really hard to do when a day’s worth of ad log files weigh in at 50GB compressed.
If we were to explore the data that we had, we needed to do it quickly and easily.
So we grabbed every report we could get from any service we could find, and proceeded to analyse the data in spreadsheets.
These reports were aggregations of all our transactions, which meant that it lost the details of each ad impression. However, by speaking with the analysts and managers in the commercial teams, we realised that these reports were enough. For now, at least.
There were other advantages to using the aggregated reports too: they were usually filtered. Raw logs may contain errors such as fraudulent ad impressions (which are ads that were served to robots, not humans). The aggregation process usually filtered these entries out, and ironed out other data issues. The reports also best represented the amount we would be paid for.
The reports were also free: to process (at least) 50 GB of raw logs a day at speed, we would require significant computational resources (by our standards, at least). By making the third parties aggregate the reports for us, it saved us that hassle and money.
But then, we realised that the spreadsheets were large enough to be a problem. The spreadsheets were slow to load and hard to read. More importantly, all the logic we applied to compute our results were hidden as formulae in cells.
As we looked at our existing financial spreadsheets, we found this remarkable beast:
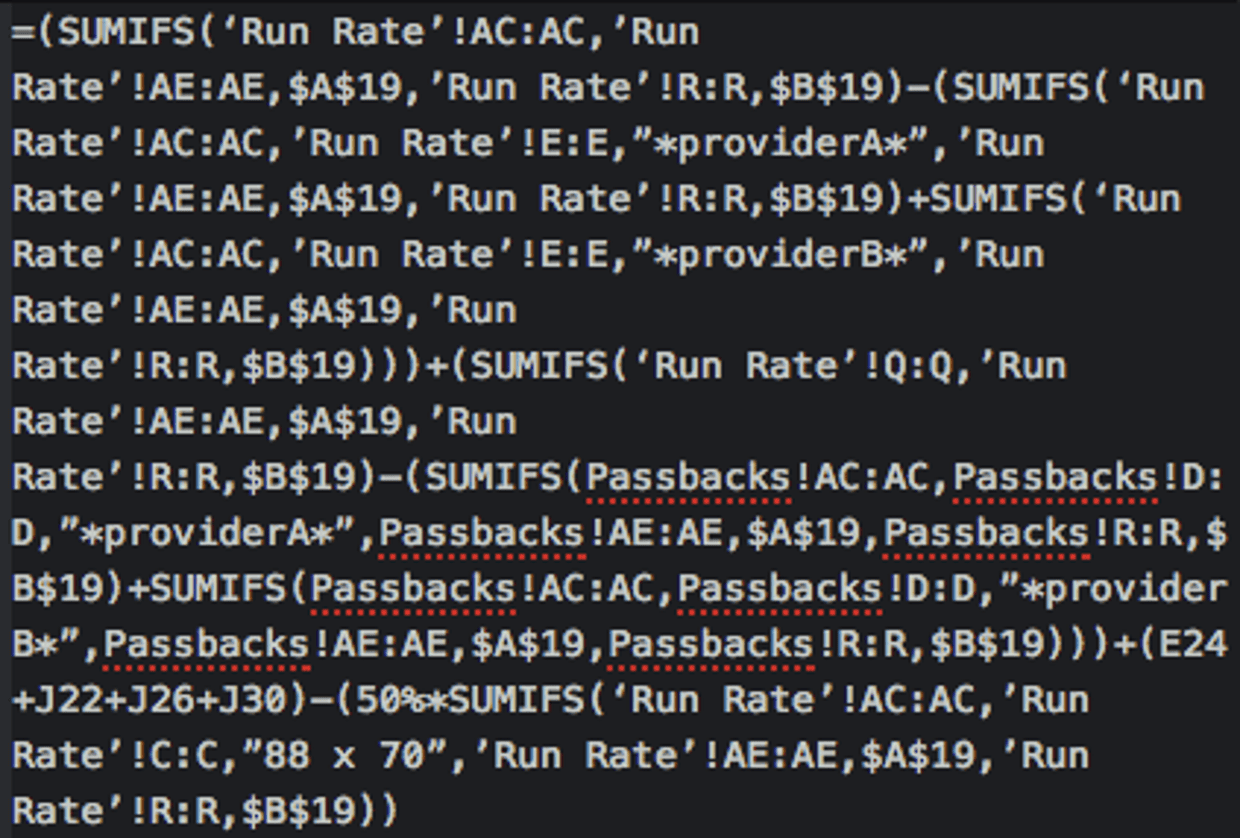
… which led us to the next learning:
“I think I’m entitled. … I want the truth!”
The “truth”, in this context, is the logic and workings that the organisation uses to compute our financial data. We needed to build a single source of truth for not only the data, but the workings applied to the data.
To achieve this, we switched from spreadsheets to code with a tool called Jupyter Notebooks.
Jupyter Notebooks are text documents that you can write code in, and then immediately execute to generate answers and even visualisations like charts and graphs.
This allowed us to show our workings, and to write documentation for it. We wrote and shared scripts that automated the report retrieval process, and then just played with the data to see what we could find.
Manipulating the data this way felt kinaesthetic. We now know how the different systems connect, where the data is reliable and where it is not. We now know what we need to build, what we need to correct and what we should just avoid.
“You complete me”
While all this work is directed to a monetary goal, it really is an attempt to bring the entire organisation together in understanding the value of what we produce.
For years, the culture of the Guardian was to separate the Editorial departments from the Sales departments: Editorial generates the traffic; and Sales sells the ad impressions that comes from that traffic.
The Technology Department usually sits in the middle trying to keep the site up from all that traffic.
In developing Maguire, we built a lot of new bridges and relationships with people around the organisation. Quite a lot of conversations ended with “Why didn’t we speak to you before?”
We hope that the Maguire Project provides a joint language that both Sales, Editorial, Technology, and Finance can use understand how each affects the other.
Rest assured: this isn’t about finding out how best to sell ourselves out. The Guardian has to operate in an increasingly competitive, post-truth media landscape. In this world, our Editorial integrity is the most valuable thing we have to offer.
This is merely the innovation and tools we need to survive this risky business.