10 days ago, we released our new mobile site on m.guardian.co.uk. Since that time there have been 126 commits to the master code branch, and over 100 deployments to the live environment, at an average of about 11 a day.
When you’re releasing code multiple times a day, you don’t have time for full regression tests. Running a full set of integration tests across all browsers can take many minutes, if not hours. When we merge code to the master branch, we run a full set of unit tests on the Scala and JavaScript codebase, as well as check the output of some key application endpoints in a headless browser. These take five to 10 minutes to run. If they pass, the code is automatically deployed to a continuous integration environment. Developers can sanity check their changes in this environment, and if they’re happy (and with the conscience of the team on their shoulders), can immediately deploy to production.
Once the code is in production, QA can really start.
Detecting failure
Sometimes deployments go wrong. We expect that; and we accept it, because people (and machines) go wrong. But the key to dealing with these kind of mistakes is not to lock down the process or extend the breadth, depth and length of regression tests. The solution is to enable people to fix their mistakes quickly, learn, and get back to creating value as soon as possible.
Across the Guardian we monitor close to 200,000 system and application metrics, but for the frontend of our new website there are two that we make visible to the team constantly in real-time: pageviews and page load times.
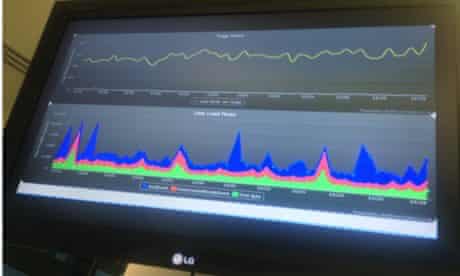
Above is a dashboard showing these metrics graphed over a 60 minute period. The top yellow line shows pageviews per minute. The bottom graph shows stats collected from the browser’s Navigation Timing API. It shows average per minute timings for “time to first byte” (green), time to “DOMContentLoaded” event (red), and time to “load” event (blue). These stats give us a good view into the state of the site for real users, there and then.
If pageviews flatline, the timing stats give an immediate clue into where the issue might be. If the green line spikes, we know it’s likely a server-side application issue. If the red line spikes, it’s likely a blocking client-side call that is failing (e.g. CSS). If the blue line spikes it’s a non-blocking client-side issue, eg. ads, or “related content” calls. If all three spike linearly, there’s likely an ISP issue beyond our control affecting a large number of users.
Importantly, these aren’t just critical graphs for the team trying to keep the website stable. They are key performance indicators for the entire organisation. If pageviews drop, the business loses revenue. If page render times increase, the business loses revenue. Wondering why we don’t just graph revenue itself in real time? We’re working on it.
Automated browser tests
To further understand the code we’ve deployed, we have a growing number of automated browser tests using Selenium WebDriver. These launch multiple browsers across multiple operating systems, and as such can take a significant amount of time to run.
We don’t want this time to be a barrier to deploying code and new features. So again the most useful place for us to run these tests is in production, immediately after a deployment. We’re also experimenting with web consistency testing using a hosted service called Mogotest. Web consistency testing automatically alerts us to possible CSS rendering issues across a range of browsers.
Detecting errors
Detecting catastrophic failure or show-stopping bugs after a deployment is critical, but there are other less disastrous client-side issues that may occur in our users’ browsers: those that wouldn’t force us to immediately roll back the code, but that we want to know about.
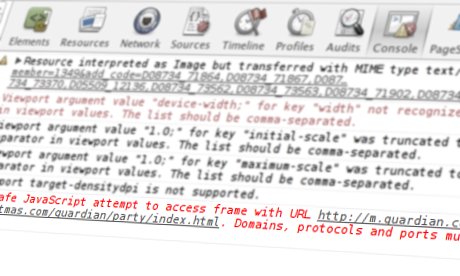
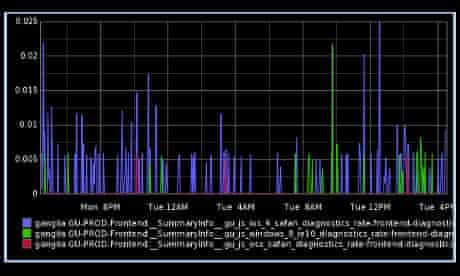
To that end, we monitor the rate and details of run-time JavaScript errors occurring on the site, which give us insight into errors that we might have missed in our browser tests, as well as hinting at edge-cases which could lead to further problems in the future. The graph below shows the number of JavaScript errors per minute on a range of different platforms and browsers over the last 24 hours.
We also log other miscellaneous pieces of data that we care about from the client-side. For example, we load and cache a custom Guardian typeface using @font-face declarations. We’ve noticed that this has some impact on rendering performance (particularly in mobile browsers). To learn more about that impact in the real world, we measure the specific amount of time it takes to render the fonts. If it passes a certain threshold, it is logged back to the diagnostics system so we can analyse which platforms and browsers struggle the most.
Similarly, we sometimes struggle to keep track of cookies, which are often set by third-party partners. To keep on top of this, the total size of cookies, and the names of cookies we don’t recognise, are sent back to our logs for further analysis.
Real-time QA
This concept isn’t really new. It’s often referred to as real user monitoring, or RUM. It’s always been important to understand what your actual audience is experiencing, rather than what your third-party monitoring tells you they’re experiencing. What’s new for us at the Guardian is using these kind of real user metrics, in real time, as a first port of call for detecting and identifying service related issues.
If you’re practising continuous deployment, then by definition your real QA is done in a production environment.