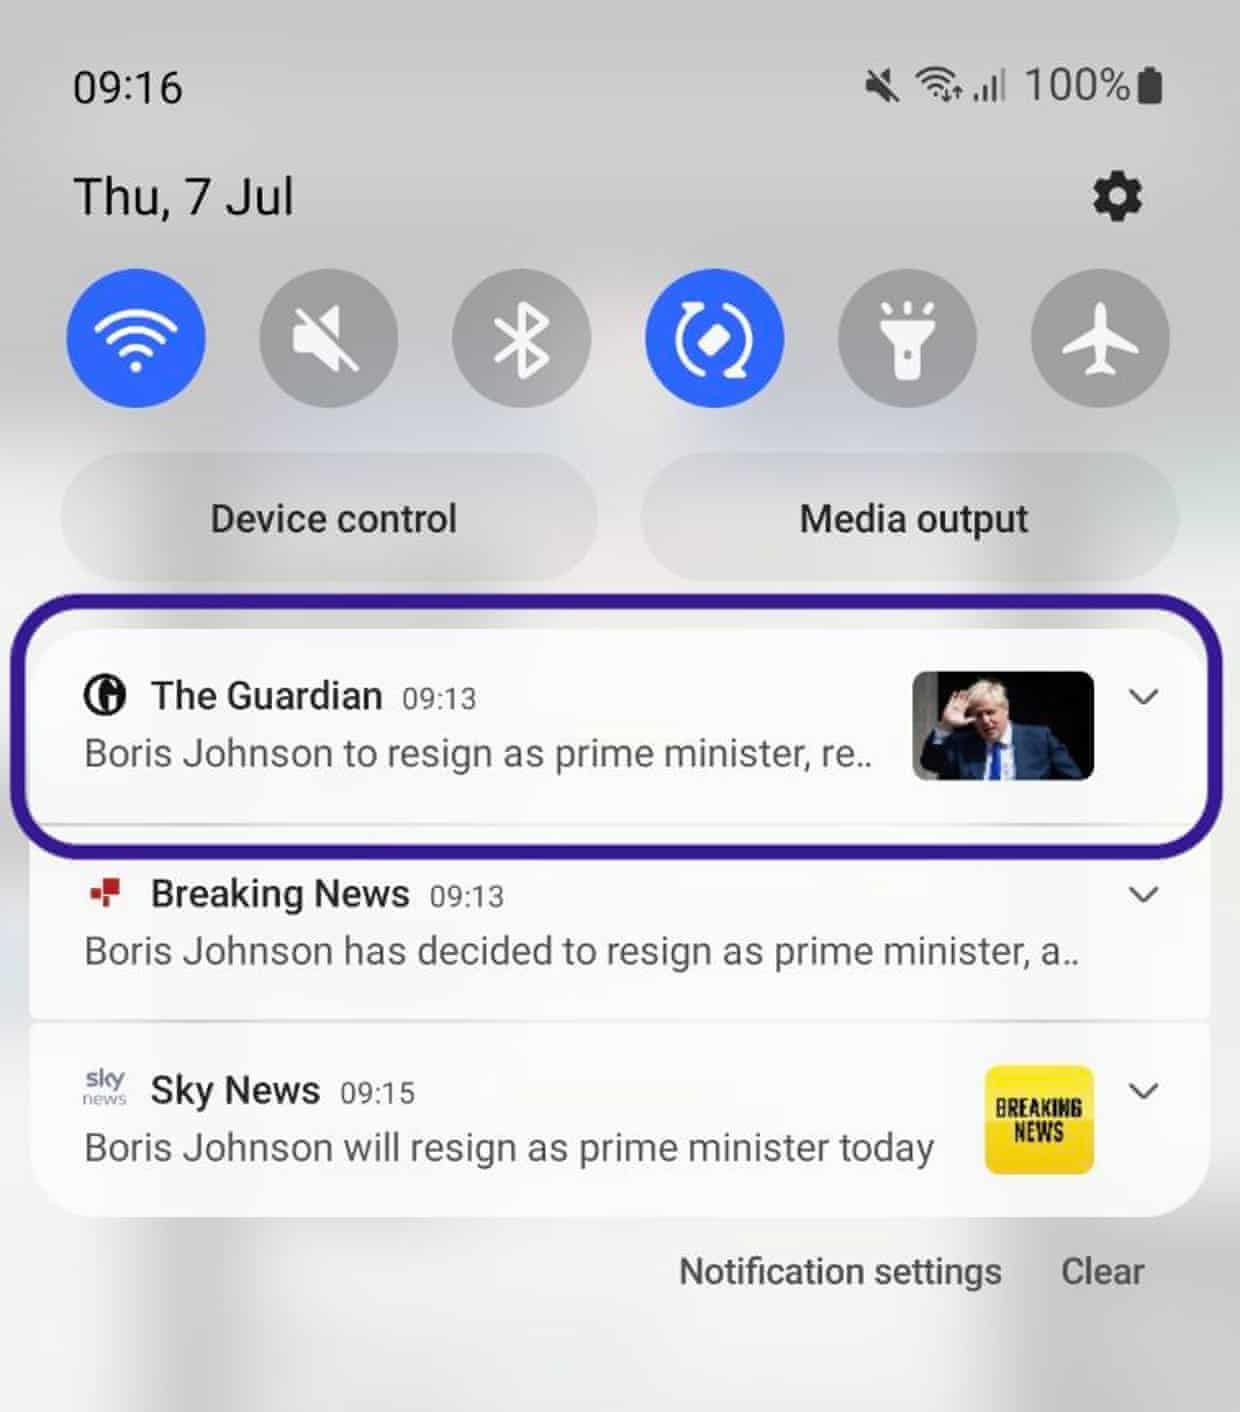
Guardian readers can access all our content via our app, available on App Store or Play Store. Guardian push notifications were adopted alongside the first mobile app which was released in 2009. On the app, our readers can be kept up-to-date with the latest breaking news stories, live blogs, their favourite columnists and sports events.
In the product and engineering department we strive for our technology to enhance reader experience. For push notifications this means ensuring the alerts we send land on a reader’s device as quickly as possible. Our digital editors take great care in curating which breaking news stories we push to readers, building trust and loyalty.
To ensure breaking news alerts are as useful and relevant to our readers as possible, our technology must deliver app notifications quickly. This year we set a target for our app notification system: to deliver notifications to 90% of the intended audience within two minutes, a target coined as “90in2”.
In the rest of this article we’ll explain how we went about tackling the challenge of supporting our 90in2 target.
How we send breaking news notifications
App users can sign up to receive breaking news alerts. When they do, the app triggers a flow that registers a token for this preference, with this token eventually being stored in a Guardian-hosted PostgreSQL database. We never store personal data in this database, just the token and the corresponding notification preference (eg “UK breaking news stories”, or “Australian breaking news stories”). We call each notification preference a “topic”. The token is important because it’s what allows Google/Apple to authorise a notification to be delivered to a specific device.
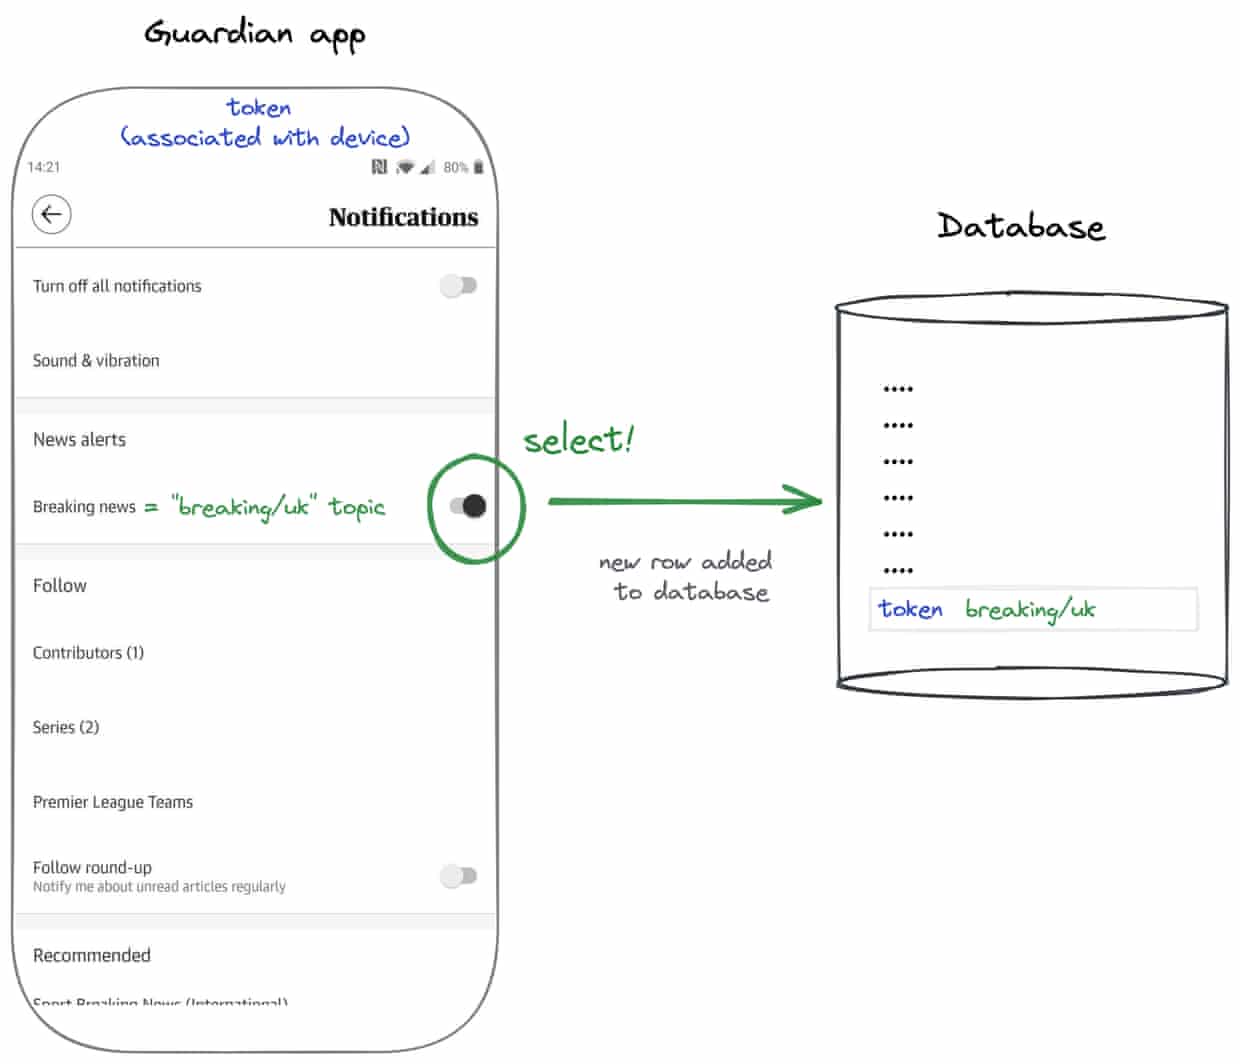
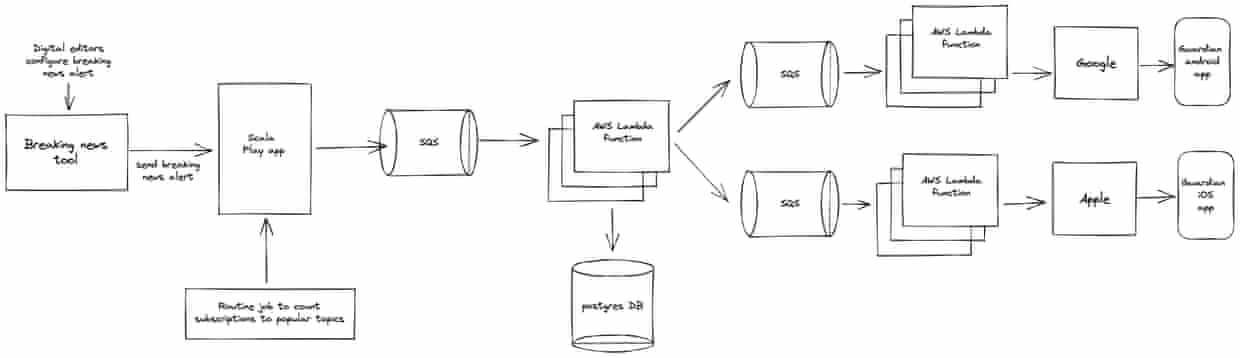
In the case of sending breaking news notifications, the process starts with our digital editors. After deciding to send a breaking news story, the notification can be curated via our breaking news tool. The tool allows our editors to select which regions to push the notification to (eg. UK, Australia, US, International), where each region corresponds to a topic. Our editors can also curate which article is linked to the notification as well as what the reader will see on their device when it’s delivered.
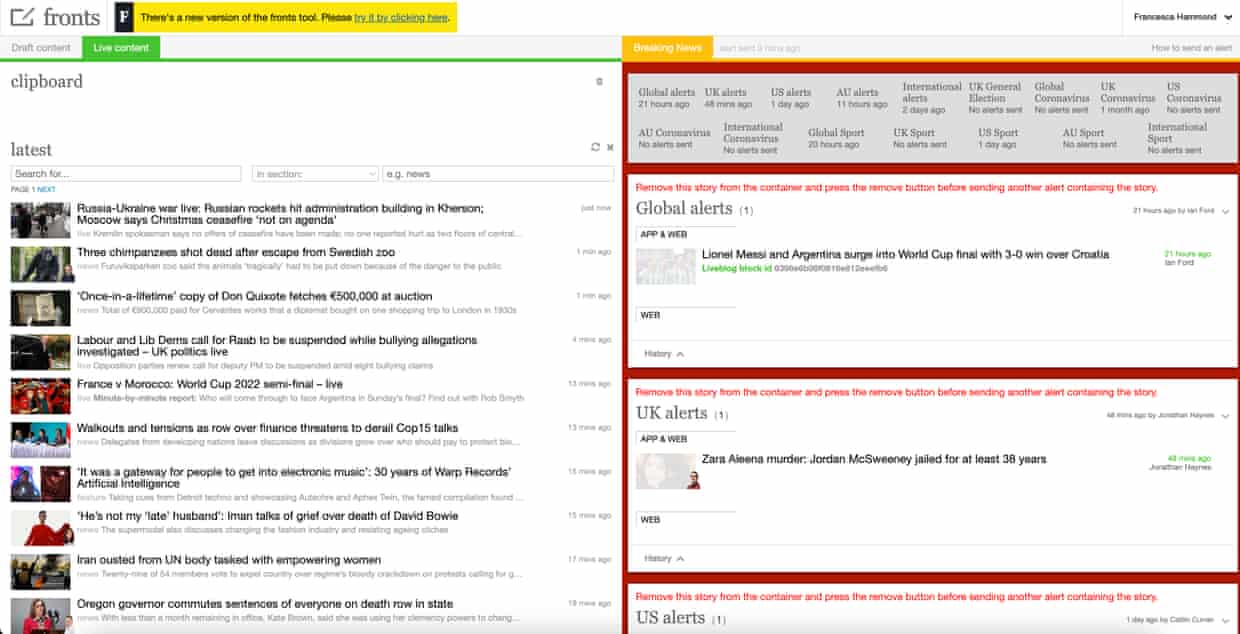
After confirming the details of the breaking news notification, editors trigger the notification to send from within the tool. The send request is handled by a Scala Play app. The app is responsible for determining how we find tokens corresponding to the topic(s) selected by our digital editors in the breaking news tool.
Our Postgres database (containing all tokens and corresponding topics) is sharded, meaning we have the ability to optimise how we query. Our breaking news topics tend to be heavily subscribed and so a single query to find all corresponding tokens to our entire database would be very inefficient. For heavily subscribed topics we make use of shards to break down our query into many equivalent queries, each one being applied to a section (or shard) of the database.
In the background, a routine job gathers information about the count of subscriptions to topics, and this cached data allows our Scala Play app to determine the optimum sharding of each database query. For each shard of the database we want to query, the Scala Play app puts a message on to an AWS SQS queue. As an example, for notifications sent to our “breaking/uk” topic we perform about 160 queries to find all corresponding tokens, meaning the Scala Play app puts about 160 messages on to an SQS queue.
When messages land on this first queue (there are a couple more, which we’ll come to in a minute) we’ve configured an AWS Lambda function to be triggered. The Lambda function performs a query on our Postgres database. It uses the appropriate sharding and topic (both included in the SQS message) to retrieve a stream of tokens. Every token we retrieve corresponds to a user who’s signed up to receive the notification we’re sending.
The stream of tokens is transformed into a set of messages that we put on subsequent SQS queues. There are queues dedicated to each platform, Android and iOS. In the same way as with the first Lambda in our flow, we trigger further Lambda functions when messages land on these queues. These functions will gather the tokens and send a request to deliver the notification to our readers’ devices.
Receiving push notifications
The architectural configuration, and the code itself, has been optimised for concurrency but our editors were reporting that sometimes notifications were taking more than five minutes to land on their devices. This frustration prompted our investigation into where our system was falling down and what we could do to support our “90in2” objective.
The Guardian’s core notification platform is all open-source, you can find further details here.
Where to start? Spoiler: observability
We had a clear objective about what we wanted to achieve, but in our small development team (3 engineers) we had no expert knowledge about the existing notification system. The team decided the approach should revolve around developing hypotheses, creating experiments to test the hypotheses, and then evaluating the impact.
The first stumbling block in the process was how we could evaluate the impact of experiments. Some pre-existing reporting logic allowed us to generate the 90in2 percentage for individual notifications that had been sent, but the data was only available 24 hours after the notification was sent and by performing a manual query. Aside from the 90in2 percentage, and default metrics generated by our AWS components, we didn’t feel we had the necessary observability.
The Guardian makes use of the ELK stack for logging, meaning our logs can be queried from Elasticsearch via the Kibana interface. Looking at the logs for a notification send process was baffling, it was difficult to correlate log messages to the same notification (we often have many notifications being processed at the same time). However, Kibana has the ability to query structured log events, enabling us to generate insights quickly and easily.
A relatively simple change added structured log events across the entire stack and following this we built a Kibana dashboard to get insights into how our system performed.
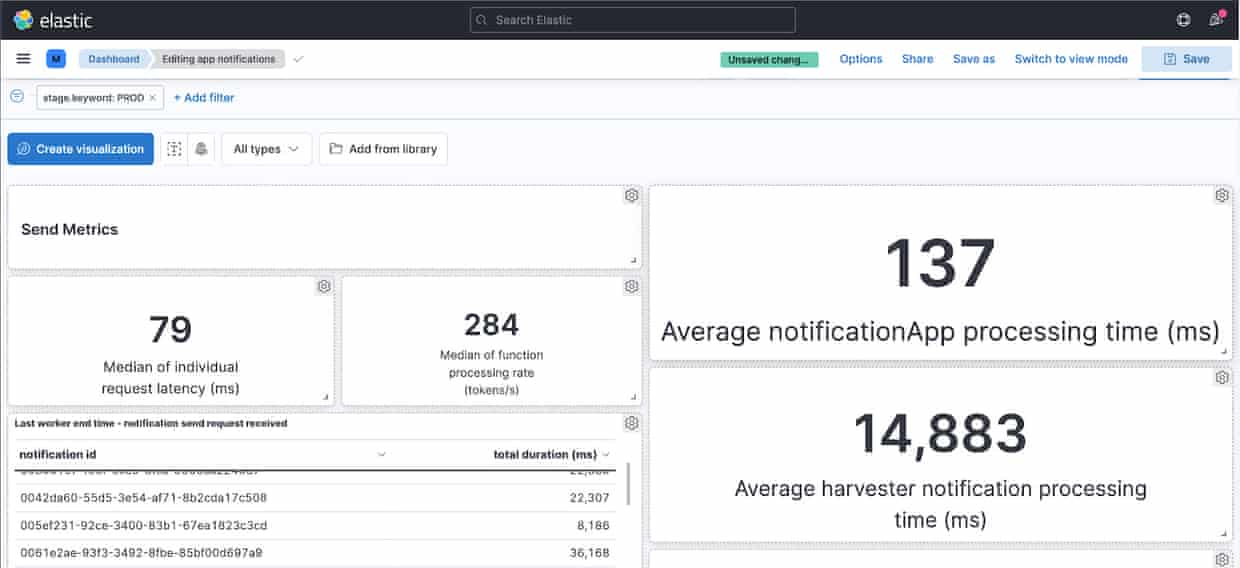
Derived from analysis of log events we came to our first conclusion: the Harvester (the function responsible for querying our database to retrieve matching tokens for the notification we’re sending) was a bottleneck. We could see a large number of database connection errors, resulting in large processing times (>120 seconds).
The database problem
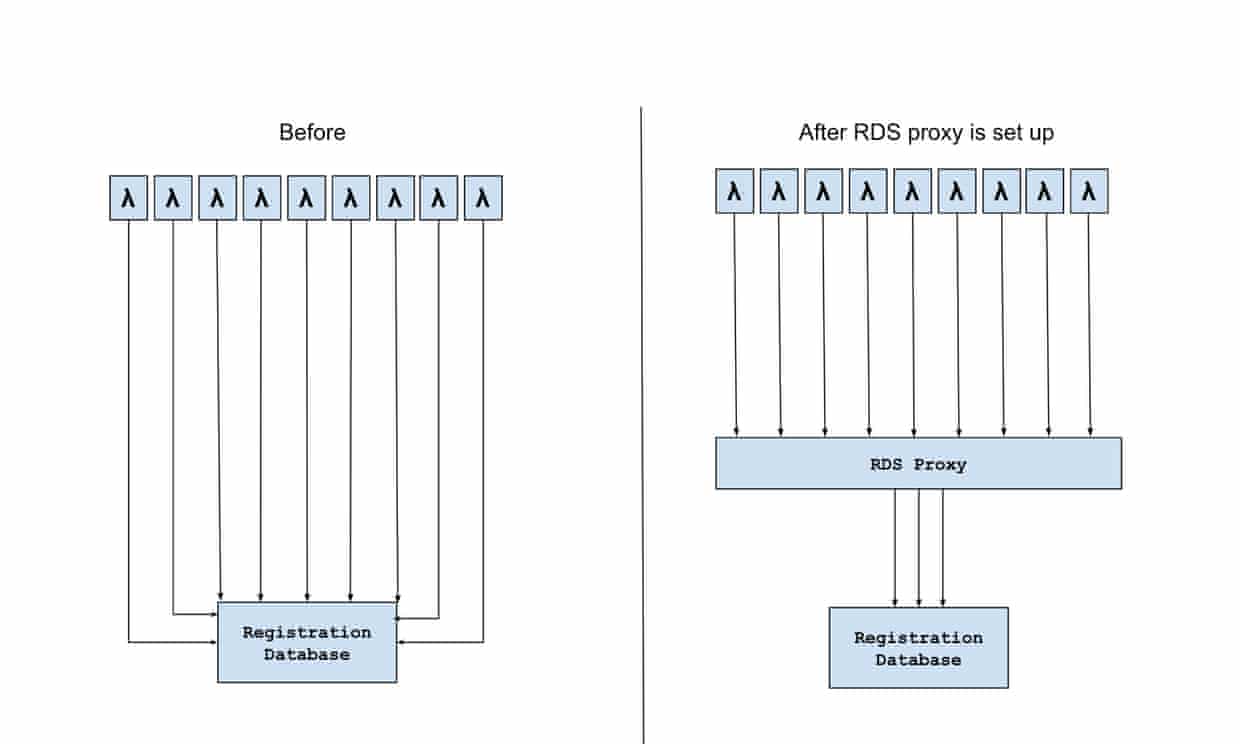
The first problem we identified from the production errors was the broken connection exceptions. It happened because there were too many concurrent connections from the harvester lambda and the database failed to handle queries from all the connections within a reasonable time. Since lambda functions are executed independently, each invocation requires its own connection to the database, and this led to a large number of concurrent database connections.
To resolve this problem, we set up a AWS RDS proxy between the harvester lambda and the database as shown in the figure below. It manages a connection pool to the database. Therefore, instead of connecting to the database directly, the harvesters connect to the RDS proxy and send queries through these connections.
The RDS proxy coordinates the database queries from the harvester functions so that the client connections will not exceed the maximum number of connections the database supports. It also moves the workload of managing client connections out of the database.
Without the proxy we saw high DB connection errors meaning the SQS message processing was not successful and became visible on the queue for another lambda to process. With RDS proxy, we only saw few DB connection errors, which leads to fewer retries and, as a result, shorter aggregated harvester duration.
Query Plan
Another problem we identified was the long query execution time. In order to investigate the performance issues, we set up another database instance with the amount of data comparable to our production database and enabled the PostgreSQL’s pg_stat_statements module for tracking the query plan and execution time of SQL queries. We ran a number of performance tests to gather the overall performance figures, SQL query time and AWS metrics.
Our study on the query plan suggested that the query was executed in the manner we intended. Its query plan is explained in the table below. Under this plan, we only read the relevant pages from the table data to retrieve the data rows.
-
Bitmap index scan: scan the index and produce a bitmap for pages which contain data row satisfying the WHERE conditions.
-
Bitmap heap scan: read the relevant pages from the table and fetch the data row.
-
HashAggregate: remove duplicate tokens.
Storage Optimization
However, the AWS metric of Read IOPS indicated that a large amount of read operations were performed when executing the query. We further discovered that the disk space occupied by the table and its indexes were about 5.8 GB, which was much more than the actual data.
We learned that when a SQL statement deletes a record from the table, the database does not delete it physically from the table storage. The record may still be needed because it is still visible to SQL queries which have started before the record deletion and have been working on this particular snapshot of the database. Similarly, when a SQL statement updates a record, it retains the old copy and physically creates a new row for the updated record. The old copy is visible to queries that have started before record update while the new record is visible to queries that start afterwards.
Over time, the table gets bloated in size with data rows (called dead rows) that are from earlier snapshots. This leads to poorer performance because it increases the I/O operations needed to execute a query.
Although the autovacuum option was enabled in our database, there were frequent updates to the table over many years. We decided to perform a full vacuum operation which, basically, rewrote the whole table to new pages without any dead rows or any unused space in between data rows. So it reclaimed as much space as possible, returned it to the system and minimised the overall storage size for the table. It also rebuilt all the indexes on the registration table.
After the full vacuum, the total table and index size was reduced from 5.8GB to 3GB. The average harvester duration was substantially reduced from 100s to 20s. Shorter query time also meant the database was able to handle more queries from harvesters. Since then, the harvester lambda did not throw timeout or broken connection errors any more.
Database Upgrade
Furthermore, we recognised that the PosgreSQL database version we were using was version 10, which was released over 4 years ago. We decided to upgrade the database engine to a more recent version (PosgreSQL 13) for the following reasons:
-
There are improvement to existing features in terms of performance and reliability
-
It supports new features such as table partitioning which may be useful to our work
-
AWS Gravitron2 processor (instance class t4g) is supported for Postgresql 12 or above. The processor delivers up to 40% better price performance over older t3 instances.
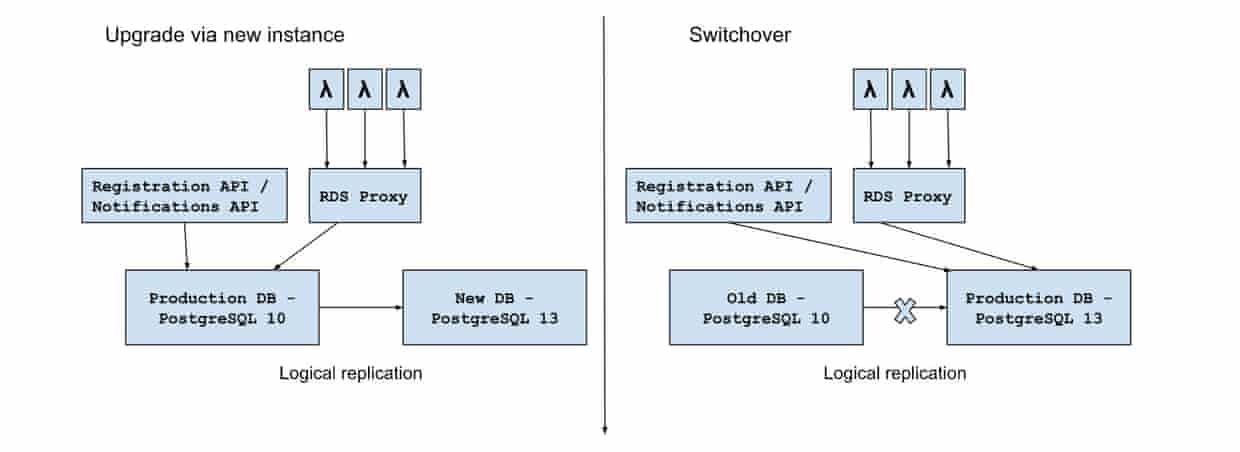
The following figure illustrates the database upgrade process. In order to minimise the downtime during upgrade, we created a new RDS instance with the same schema but without data. After upgrading it to PostgreSQL13, a logical replication was set up to continuously replicate the data from the production database to this new instance while the notification services were serving requests and updating the data. After both databases were synchronised, we switched all the notification services over to the new RDS instance and then immediately disabled the logical replication. At this point, we successfully upgraded the production database to PostgreSQL 13.
Result
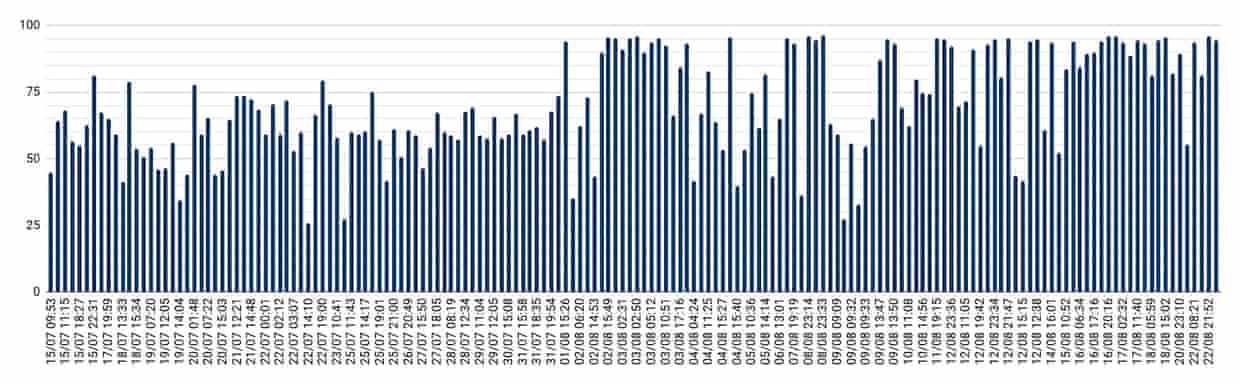
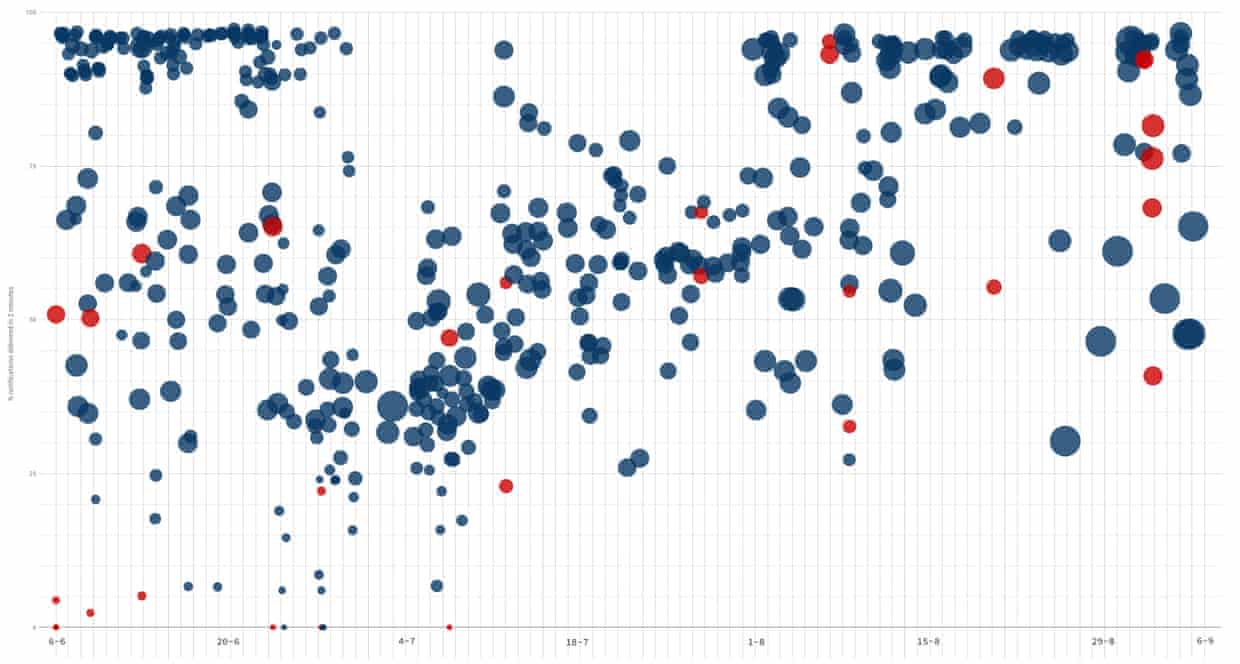
The following graph shows the improvement on the percentage of our notifications that were delivered under two minutes during our database improvement work.
The next bottleneck
With database improvements in production we saw a big improvement to our 90in2 percentage, with many more notifications being delivered within two minutes. However, we weren’t always meeting our target. Looking again at our Kibana dashboard, we could see that the bottleneck had shifted to our worker Lambdas; it was taking up to 240 seconds for these Lambdas to complete when the number of recipients were “large” (>800,000).
The worker Lambdas are triggered by messages landing on an SQS queue. They receive a list of tokens in each SQS message and are responsible for sending them to Apple/Google for eventual delivery to devices. We identified a couple of metrics to understand why this part of the process was taking so long:
-
The number of concurrent executions: AWS will spin up a maximum of 60 lambda execution environments per minute, but we were regularly seeing that our maximum concurrent executions peaked at about 75, when our predefined maximum was 250. We wanted more lambdas running in parallel to process messages quicker.
-
The approximate age of messages on the associated queues: this time represents how long an SQS message remained on a queue before it was processed by a Lambda function. We saw some (surprisingly) high values for this, peaking at 180 seconds (!!). We wanted this to be as small as possible, meaning messages would be processed (almost) instantaneously.
-
The duration of our Lambdas: this represents how long each function invocation took, and we wanted as small a duration as possible.
In deciding what experiments to carry out (we ended up doing 14 in total) we were led by insights from our log events and metrics. We’d collected baseline performance metrics and used these to understand if experiments were successful, only retaining the ones that delivered an improvement. Although not all were successful, here are some of the highlights:
-
Provisioned concurrency: the theory was that if we configure a minimum number of continuously warm Lambda execution environments it would reduce the overall processing time. We’d need fewer cold starts and have more Lambdas ready to process messages from the queue. During testing we didn’t see the number of concurrent executions increase, or the approximate ages of messages on the queue decrease. Given it was still in AWS’s hands to allocate a Lambda function to process a message, there were parts of the process out of our control. The experiment wasn’t retained!
-
Thread pool size: Scala creates a default thread pool equal in size to the number of available processors. By increasing the thread size we hoped to reduce the Lambda duration; the theory was that we would have more threads processing requests in parallel. Each of our threads do comparatively little work (mostly making or waiting for HTTP requests) and we saw a reduction in Lambda execution time without drastically increasing the CPU usage. We kept this experiment!
-
Memory: we increased the memory assigned to each of the lambdas up to the maximum. This increases the CPU assigned to the lambda execution environment, the result being a reduction in Lambda duration. We kept this experiment too.
We learnt how the process of making small, isolated changes enabled us to get results, make decisions and decide what to do next, quickly. Being data-led meant we were ruthless in our decision-making: if it didn’t work then we reverted the change, constantly evaluating the results and trying something else. You can see in the following graph the impact our work had on our 90in2 objective.
What next?
We’re not done yet! We think larger changes to our architecture might be needed in order to achieve our 90in2 target, specifically when considering larger notifications sent to 2M million+ subscribers. Because of the nature of the changes required, we want to try implementing an RFC-style process to gather ideas and feedback before starting development. We’ll be continuing to experiment, considering questions like:
-
Would migrating Lambda to EC2 enable greater vertical scaling?
-
If we make fewer http requests (by grouping tokens) will this reduce duration?
In this next phase we understand that there won’t be as many small changes, but we’ll continue to use data to drive our decision-making… Watch this space!