
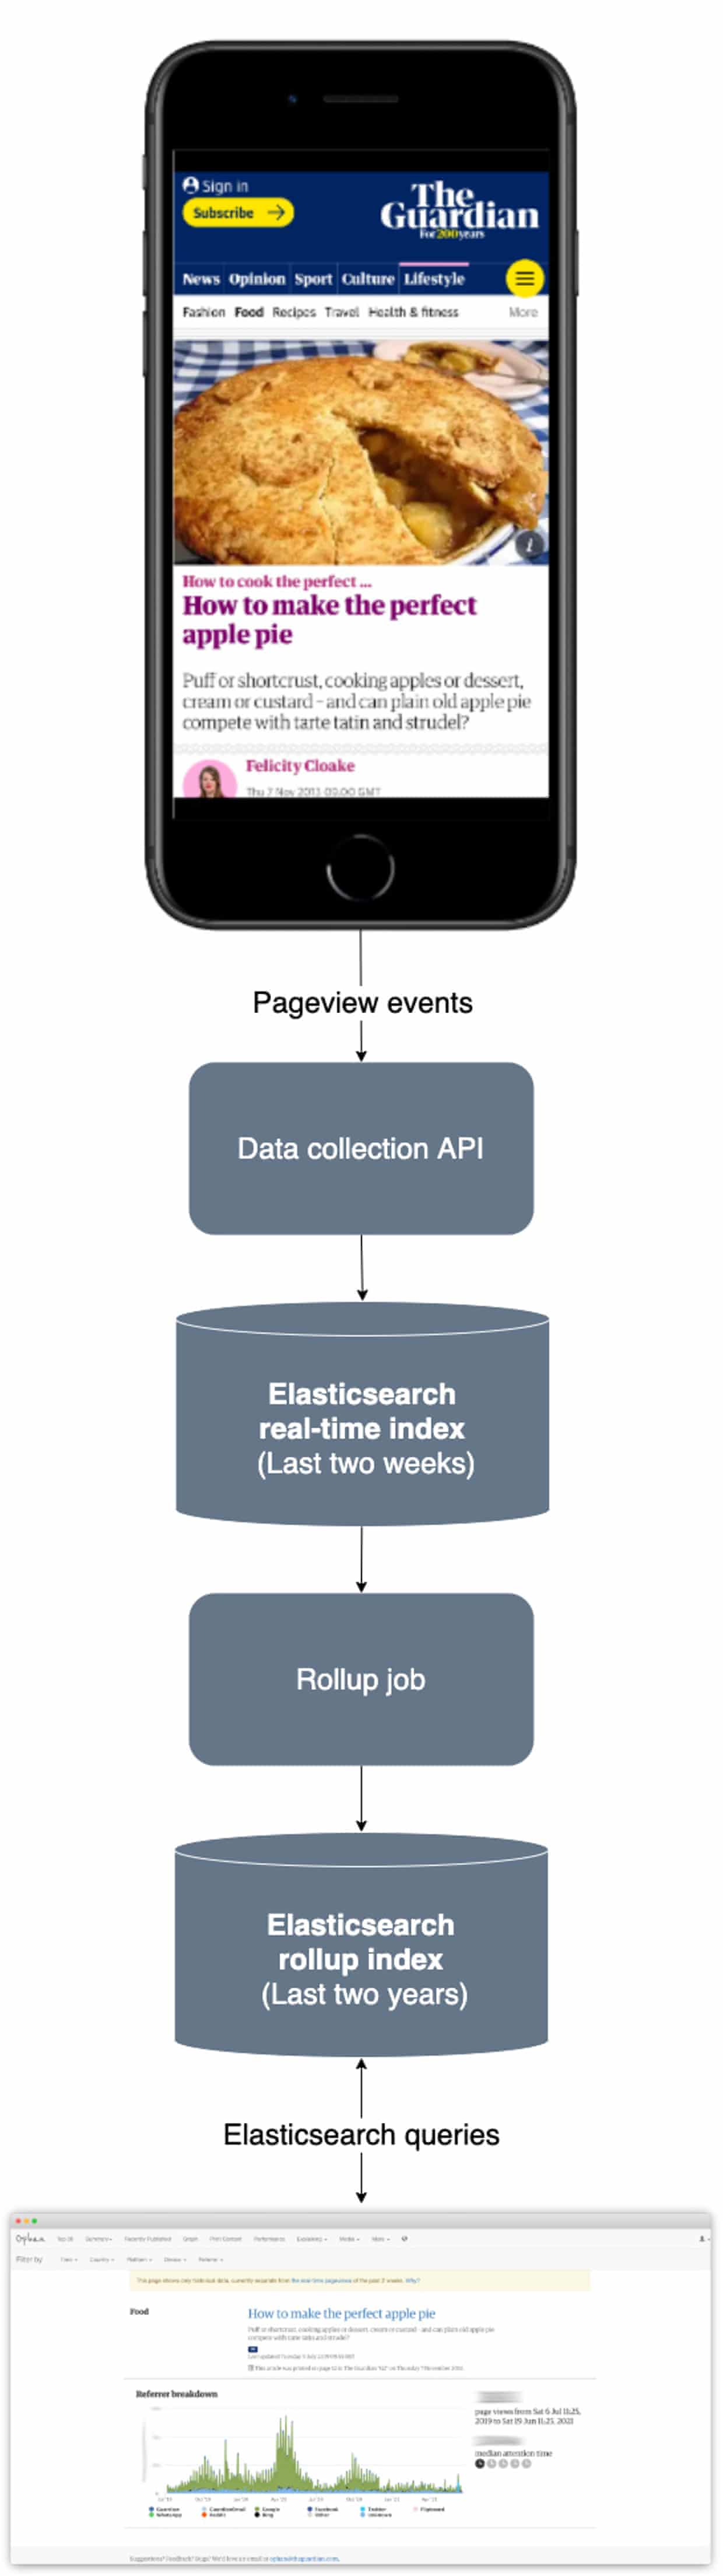
Ophan is our analytic audience tool we built that lets journalists see how stories are performing. Its metrics include number of readers, where those readers are coming from, and attention time. Until recently Ophan’s time frame was the last two weeks, and now it is the last two years.
What is the backfill?
Ophan’s data is specially formatted and stored in Elasticsearch, an open-source distributed search and analytics engine.
Storing a lot of historical data in an Elasticsearch data store can be prohibitive from a storage cost perspective and inefficient from a performance perspective. Fortunately, Elasticsearch recently introduced a new Rollup feature, which makes it possible to diminish the size of data by reducing the granularity of old data.
This meant that in addition to two weeks of super granular real-time data, Ophan could add 54(!) weeks of ‘rolled up’ historical data:
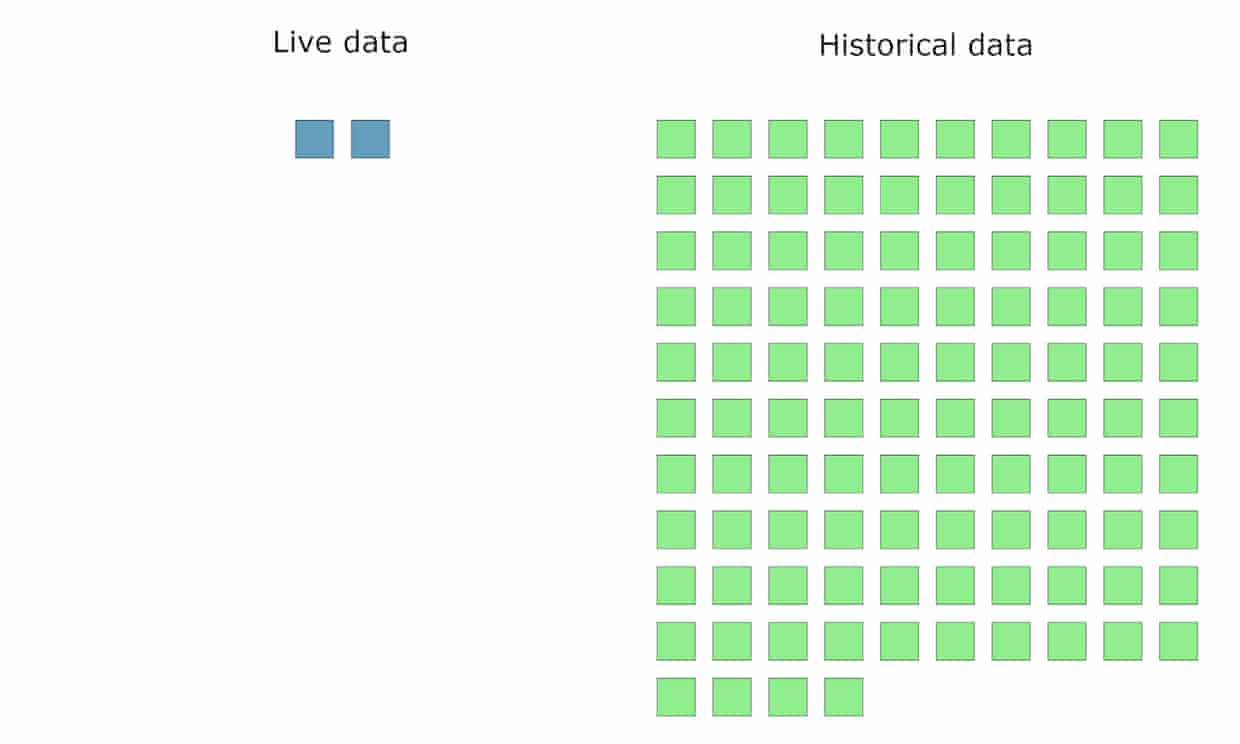
Two-weeks of super granular real-time data - what we already had - could stay in its own lane, but years of aggregated historical information could sit alongside it.
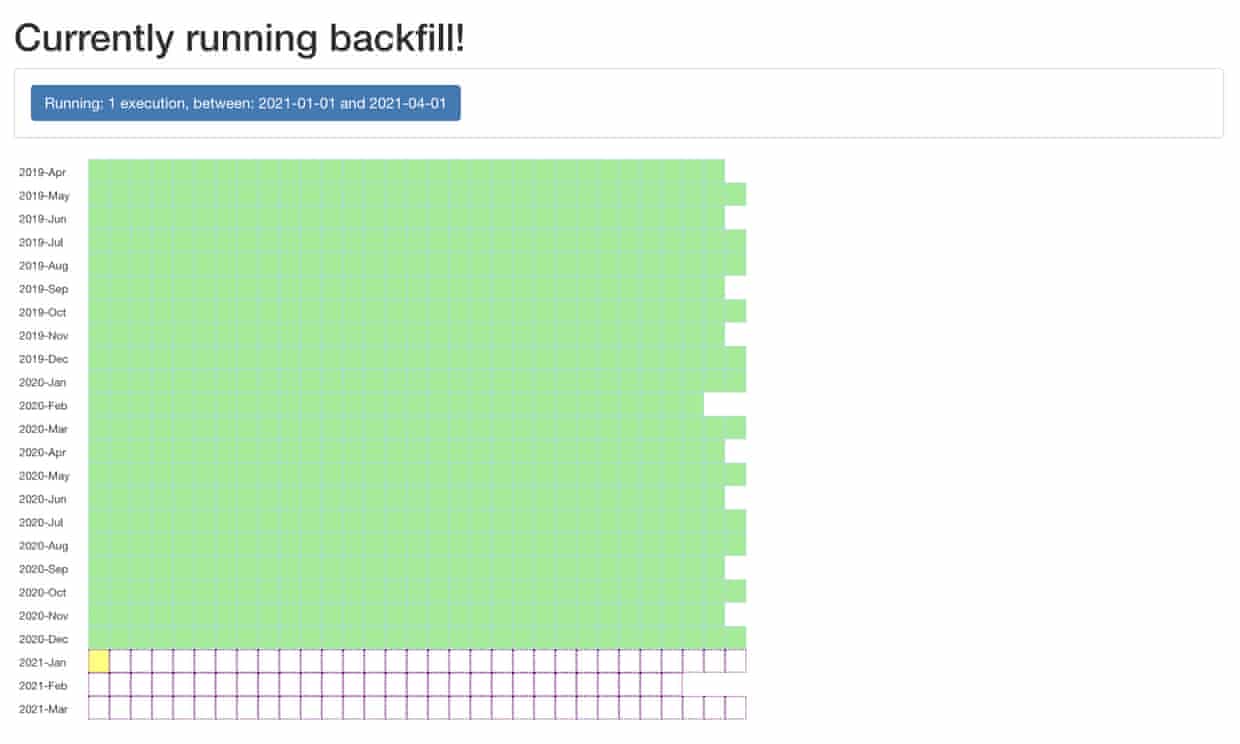
For historical data to be displayed, all those weeks needed to be filled, but because we have not done it before, they were empty:
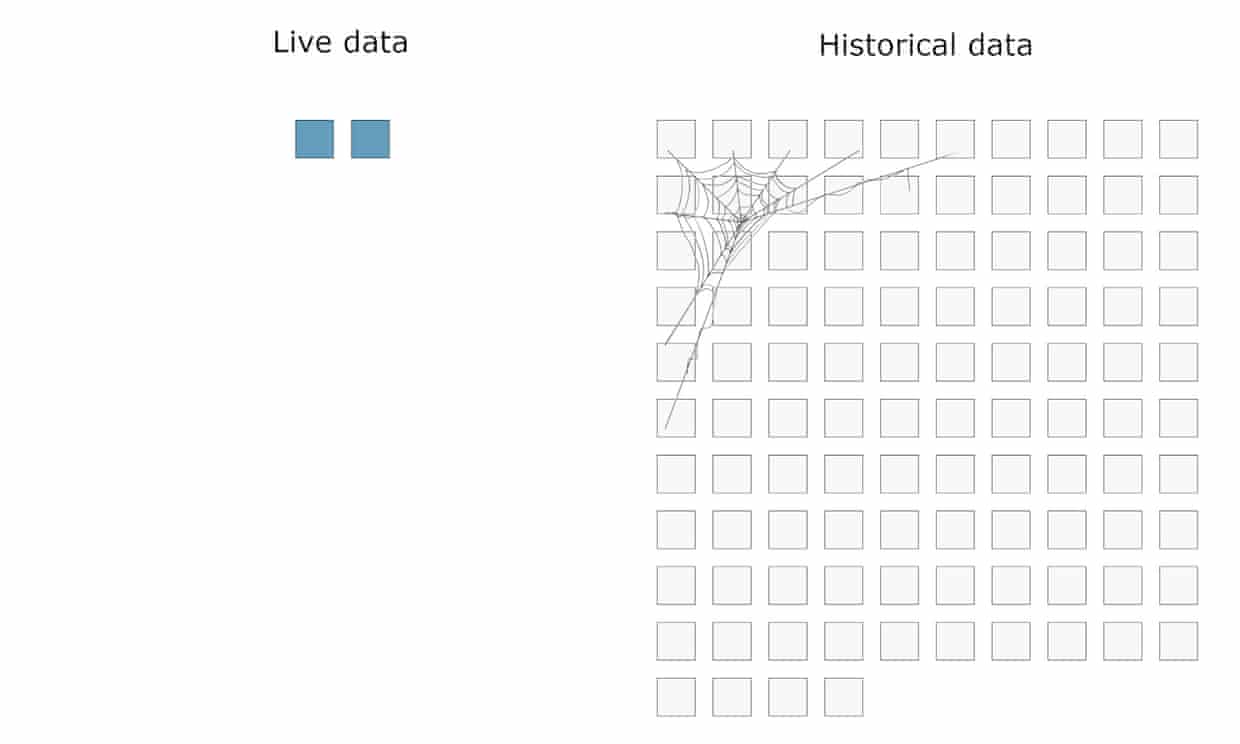
To fill those two years of historical data, we could have started using that feature and collected data, but it would have taken us, you guessed it, two years:
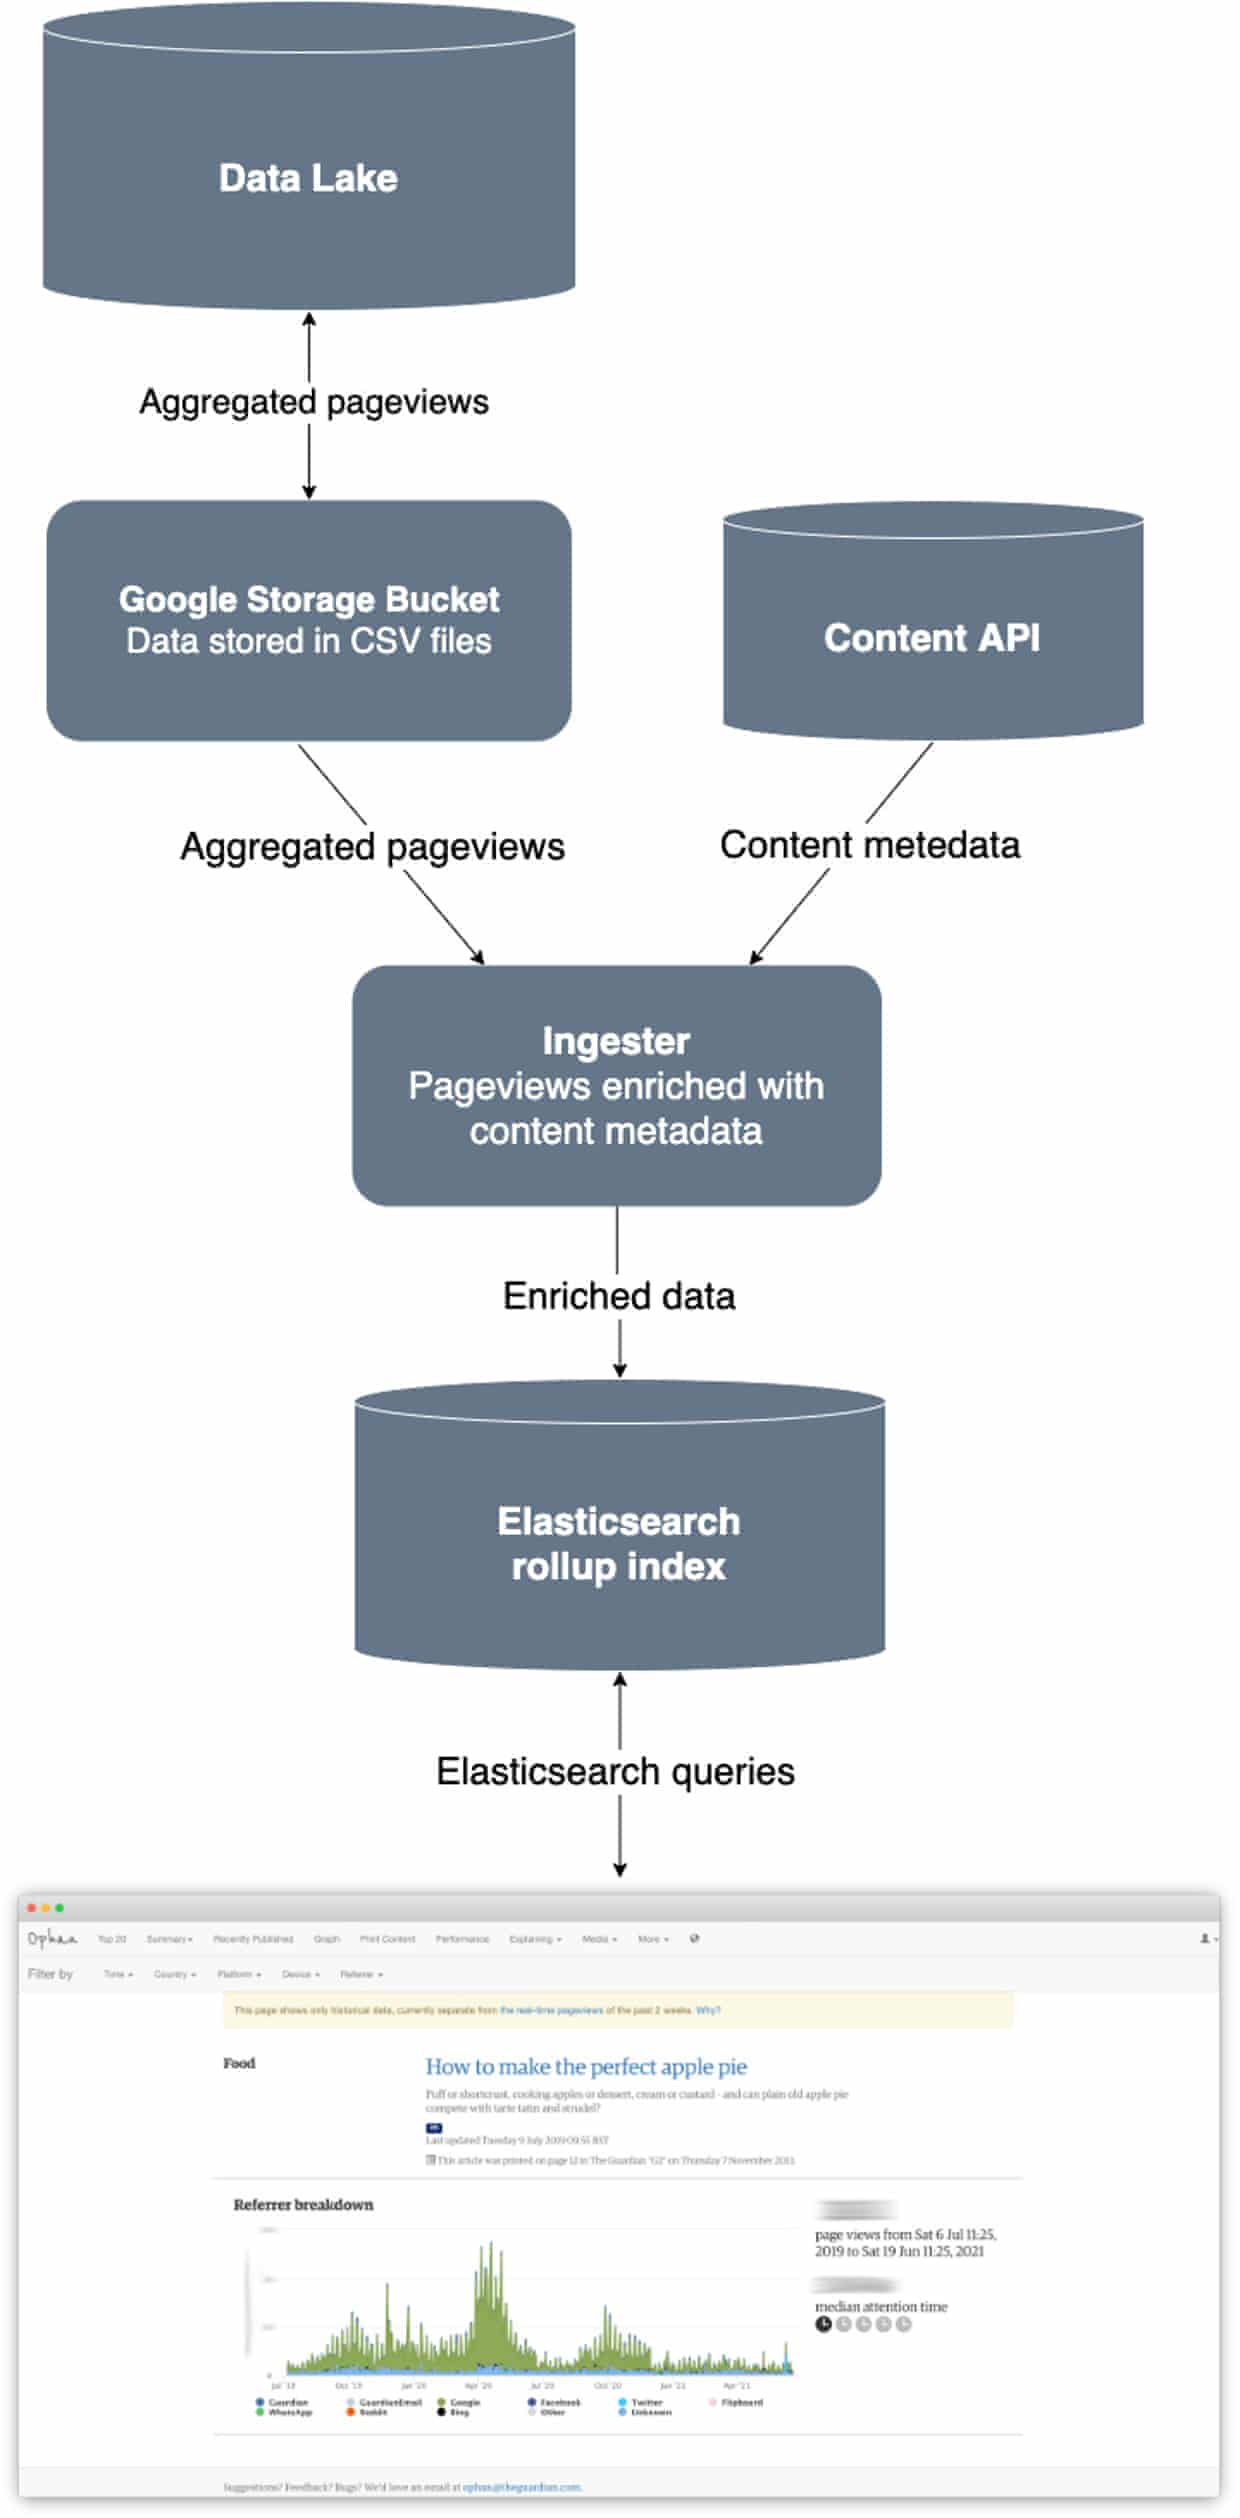
However Elasticsearch is not the only data store where we store page views data, we indeed send collected data to our generic data lake.
Simone Smith, one of our software engineers, showed that we could extract this data from our warehouse and fed it directly into the historical index, by manually crafting some old data into the specific Elasticsearch rollup format.
The backfill process
At this point, this extraction process needed to be automated. As Ophan’s technical lead Roberto Tyley recalls the two-stage process:
-
1. Query our data lake to aggregate and extract pageview data to static files containing minimal data. This all took place in Google Cloud, with the files being stored in a Google Storage bucket.
-
2. In AWS, run a long-running Step Function activity, streaming those files into memory, augmenting them with content metadata and finally uploading them to Elasticsearch in the special Elasticsearch Rollup format.
Step one is where aggregation happened. This was done using BigQuery and ensured the amount of data being exported was as small as possible. The most feasible compact data format was CSV, which led to the introduction of the kantan.csv library. This made reading and translating the format much simpler.
In step two, the contents of these files needed to be augmented before being fed into Elasticsearch. This took place in the ‘ingester’, which took CSV data and turned it into something Ophan-friendly.
Using the article path, the ingester found that missing data from the Content API. An internal cache ensured any given path only had to be looked up once.
The sheer volume of data involved meant a streaming API was needed. The ingester brought through bite-sized chunks that its memory could handle.
Refining and monitoring
Roberto pointed out that a key part of the reactive process was the concept of ‘back pressure’ - when data comes in faster than it can be fed out. Although back pressure could have been handled manually, a library called Monix offered a way of responding to such imbalances in real time, ensuring the ingestion process didn’t get indigestion.
By regulating the flow of data - complete with restart instructions should the process hit a snag - the ingester could hum away at a reasonable, manageable, yet efficient pace.
The backfill itself only took a couple of weeks. One of the Ophan team software engineer, Paul Roberts, put together a ‘checkerboard’ monitoring its progress. As data completed its journey from the data lake to Elasticsearch, the squares - each representing a day - filled up and turned green. If the expected document count was out by one either way, the box would instead turn yellow.
The advantage of time and other benefits
The Ophan team was given the time and space it needed to do the backfill properly. It was understood that, while there was nothing to see for a while, all the work was still being done behind the scenes. Leigh-Anne Mathieson, a software engineer on the project, observed this was helped by the interest of stakeholders and their enthusiastic engagement in the inner mechanics of a product.
The backfill’s most immediate benefit was that historical data would have two years in the bank at launch. It also safeguarded the quality of information. Head of editorial innovation, Chris Moran understood the importance of maintaining data accuracy.
It also provides a useful recovery mechanism. Should the historical data be lost or needs reformatting, then it can be recovered. The backfill process also allows for much greater flexibility as a ready built infrastructure for future innovations.
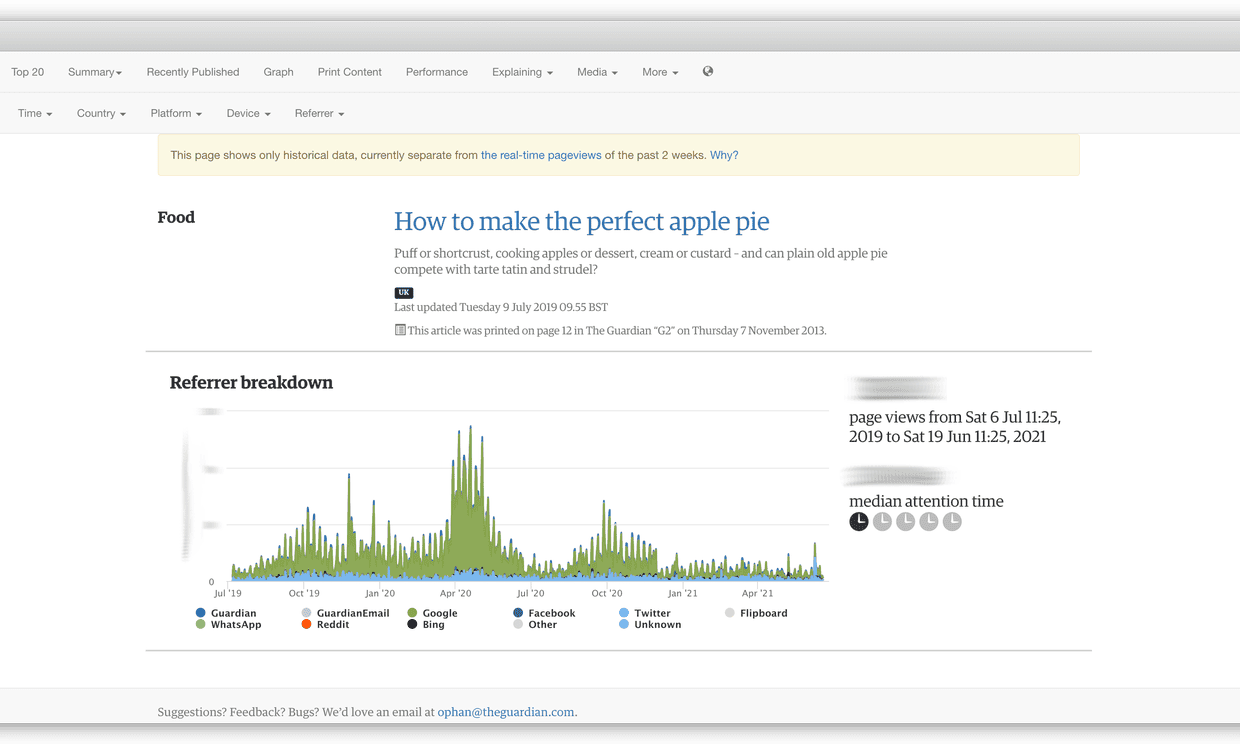
Interest in baking skyrockets during pandemic lockdowns. Who knew?
This latest update is one of the biggest steps forward for Ophan since it was released to the newsroom - a collaborative effort from the engineering team that now allows our journalists to access more information than ever before.