
This is part two of a series of three blogposts about the first year of the new Investigations & Reporting team, a small group of software developers embedded in the Guardian newsroom. Read about our work on environmental reporting here and Covid-19 investigations here.
The 2019 UK general election campaign was a big test of our ability to work with journalists to an editorial deadline. We used all the knowledge and skills we had gained while working on the Polluters Project.
The Guardian’s editors decided that tracking digital campaigns would be a significant strand of our election coverage. We knew that all parties were likely to go into overdrive when it came to online advertising. To put a spotlight on the opaque nature of algorithms, we decided to show readers what political adverts other people were seeing on Facebook.
The software engineers in the investigations and reporting team were in a good position to help gather such data. Not only had we worked with the Facebook Ad Library before, but we were now sitting in the newsroom next to journalists, allowing us to collaborate daily. We teamed up with David Pegg, Pamela Duncan and Niamh McIntyre to produce the Election Digital Dashboard – a month-long series of articles covering, among other things, political advertising on Facebook.
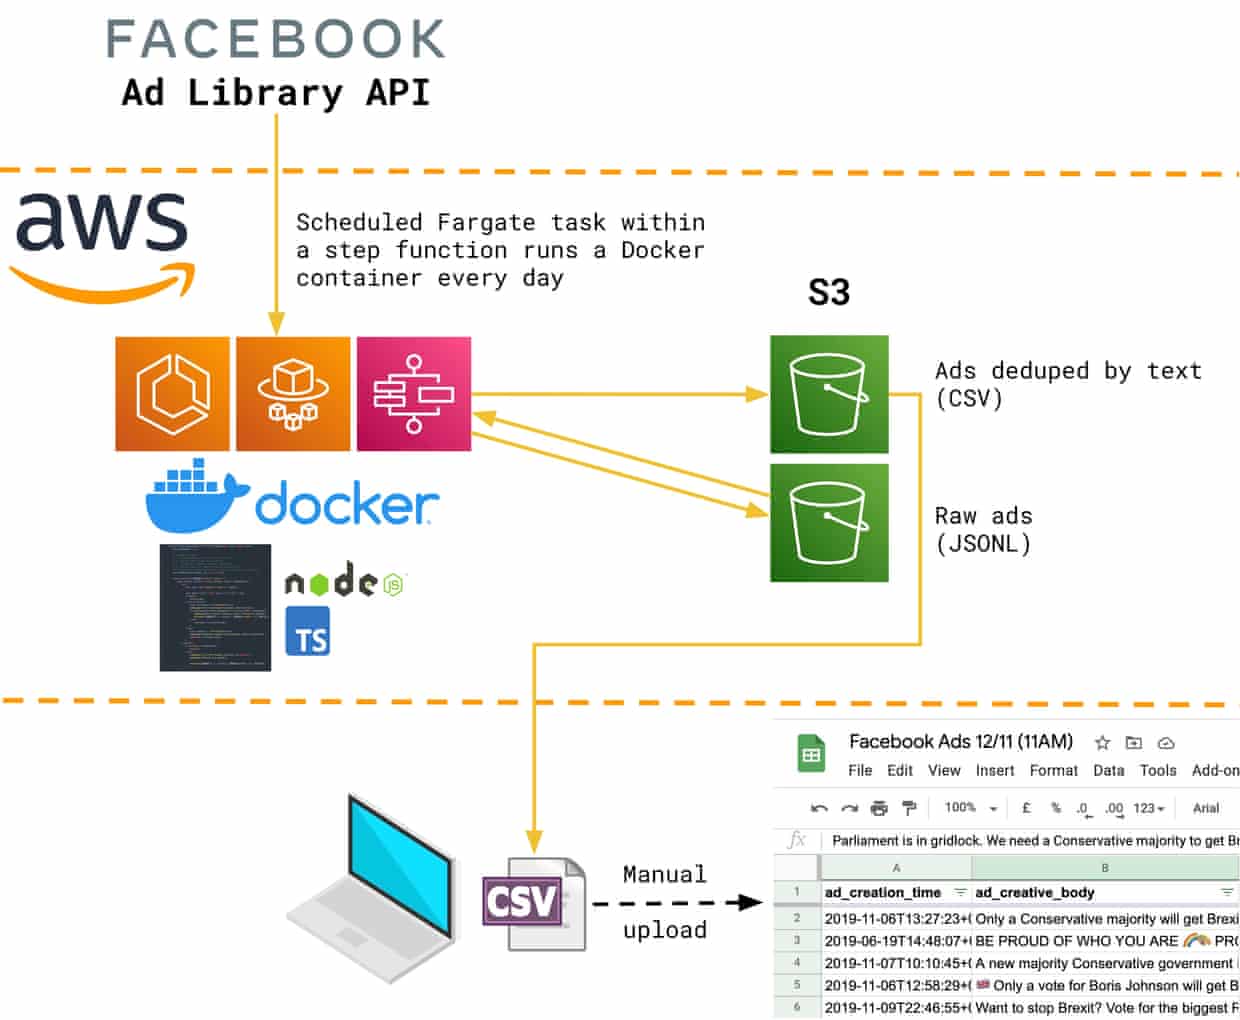
The date for the election, 12 December, was approved by Parliament on 29 October, so we didn’t have much time to plan and write a lot of new software. We adapted our Polluters Project scraper to gather daily snapshots of what political ads were active on Facebook in the UK. We used deliberately broad search terms to gather as many ads as possible and we often saw multiple entries in the library with the same text: evidence, we believe, of A/B testing and targeting particular demographics or regions. To make this intelligible, we wrote Node.js scripts that deduplicated the ads by text and produced a daily CSV of unique active ads. This was then loaded into a Google Sheet for browsing, sorting, filtering and aggregating, making it easy for journalists to find, say, the most frequently seen Labour ads.
Even then, the limitations of the data provided by Facebook hampered certain lines of inquiry. Particularly frustrating was the absence of useful regional targeting data. This was after all the election where the conservatives would “take the north”, so constituency-level analysis would have been fascinating. Facebook’s advertisers have postcode-level control over where their ads get targeted, but the granularity in the company’s “advertising transparency” service went no further than England, Scotland, Wales and Northern Ireland.
As we got closer to publication each week, the pressure to double and triple check our findings grew and our CSV-producing scripts became a source of bugs, especially as we attempted more complex analysis of the data. So Joseph Smith, drawing on his experience with the Guardian’s reader revenue team, put our data into Athena, an AWS service that runs SQL queries against files in S3. By simply storing the JSON responses from Facebook’s API in S3 and defining a schema for them, the effect of many lines of procedural TypeScript code could be replicated by a single declarative SQL query. Using Athena’s CREATE TABLE AS SELECT (CTAS) functionality, we could easily store the de-duplicated ads produced by this query in S3 with a table schema over the top, avoiding the need to recompute on the fly.
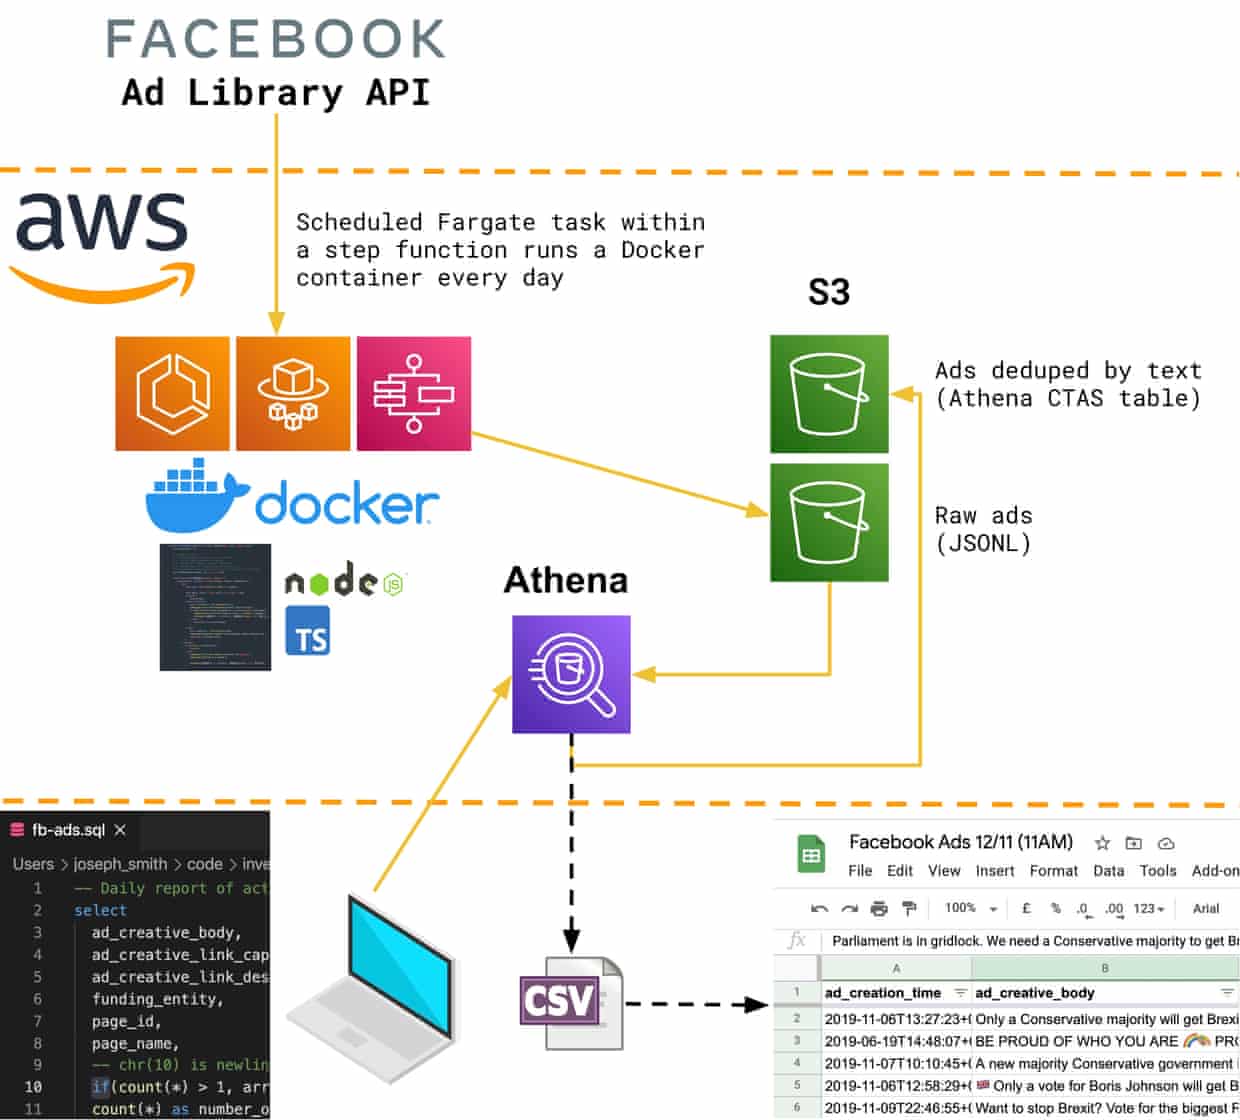
Within a few days we had switched our analysis over to our brand new data lake. It was more reliable, the results easier to trace back, and it provided a flexibility that was later key to pitching more complex stories. Articles delving into the demographics that each party was targeting were backed by Jupyter notebooks explaining our working, all powered from this lake.
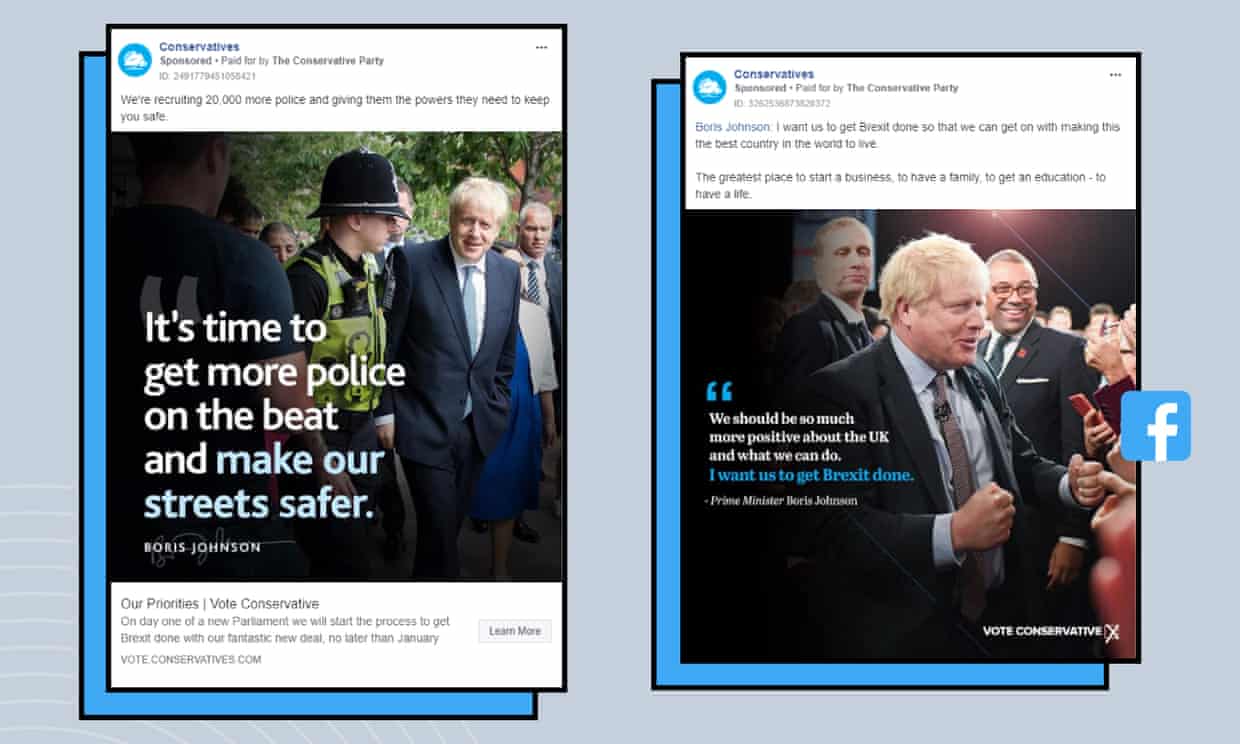
Throughout this process we had been collaborating with editorial, talking to them about the ideas they had for stories and working out the best way of supplying them with the data they needed. As the weeks went by, we became more confident at noticing interesting trends and making suggestions. For instance, using Athena in this way allowed us to easily ask questions in SQL such as “which ads were seen only by one gender?” This led to the newsworthy discovery of contrasting conservative messages to male and female users. An advert seen only by female users read “we’re recruiting 20,000 more police and giving them the powers they need to keep you safe”, while male-targeted ads claimed post-Brexit Britain would be the best place to “start a business” and promised a conservative victory would “unleash the potential of all our towns, cities and villages”.
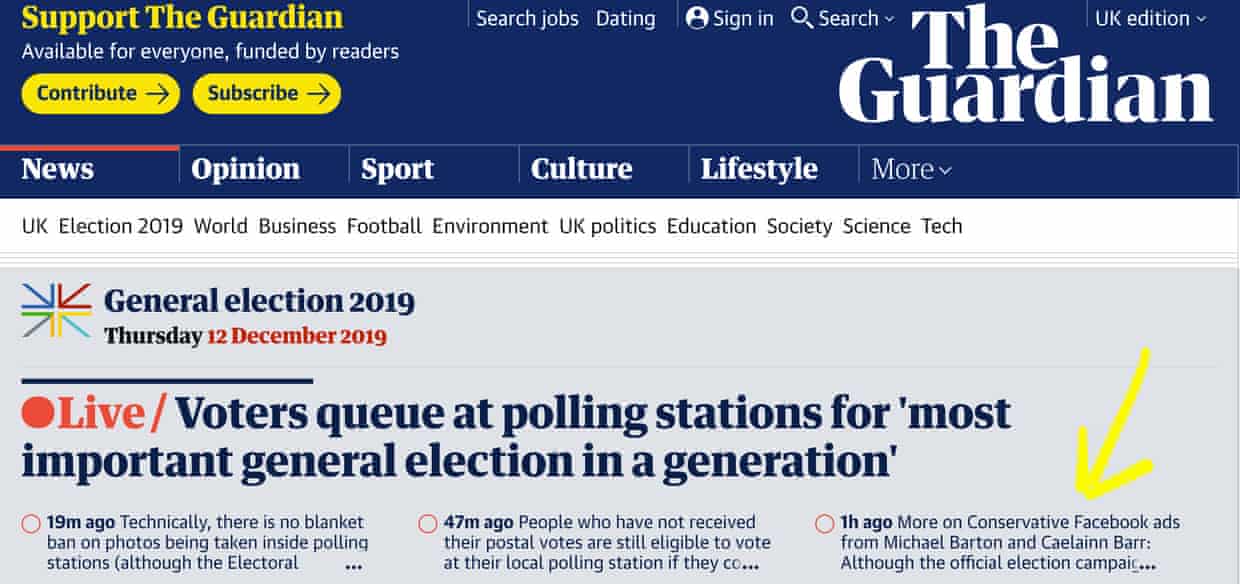
On election day, we noticed an increase in conservative adverts where the text had been copied from older adverts but the constituency name had been changed. We realised they had focused their ad spend on certain constituencies, leaving some with barely any. Some of these constituencies were marginal or traditionally blue, suggesting the party was either confident of victory or had considered the constituency lost. With help from data projects editor, Caelainn Barr, we tidied up this research and shared the story with the news desk. For the next hour, it sat at the top of the election day live blog.
This project was proof that developers in the newsroom could make an impact. Many of the challenges we faced did not fit neatly into the realm of traditional software development. For example, the imprecise impressions and spending data provided by the Ad Library API challenged our confidence in our findings and we were grateful for the patient help of the data projects team when validating our analysis. During the process we’d formed close working relationships with journalists, and these relationships proved essential to the success of future projects.