
A product strategy discovery in practice
A few months ago in the Guardian apps team, we realised we needed better information to make product decisions and move forward strategically. We want to feel confident that we are constantly delivering value to our users while ensuring business sustainability. Using fresh insights, we realised our current value proposition wasn’t fully aligned with user needs. This article presents our journey and what worked for us.
1. Defining objectives
We started by reflecting on the questions we wanted to answer in light of our business objectives (OKRs). However, we also wanted to apply jobs theory in order to understand why users hire, or fire, our product, what are their current struggles and anxieties and are we helping them make progress in the context of their lives.
Our goal was to define the role that our product plays for our users and for the business.
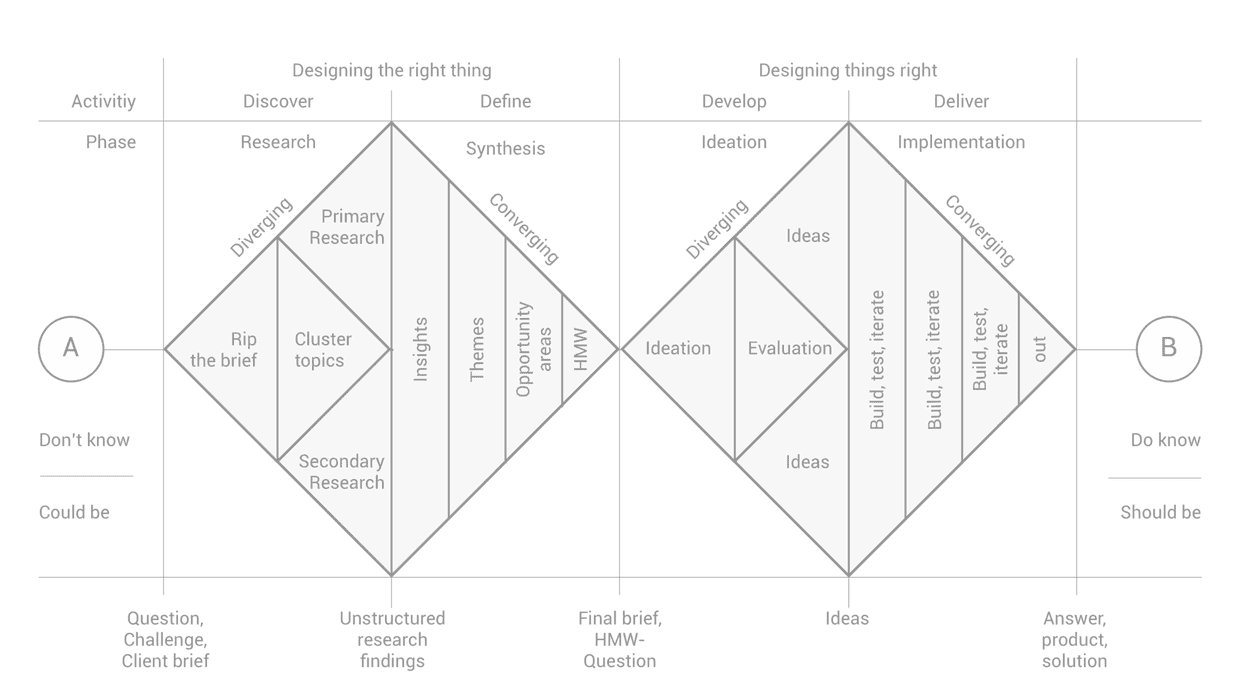
We planned our work using the double diamond approach with its divergent and convergent phases of research, synthesis, ideation, and prototyping.
Our core team was composed of one product manager, one designer and one researcher, but collaboration with other teams was intense to keep experiments and implementation evolving in parallel.
2. Communications strategy
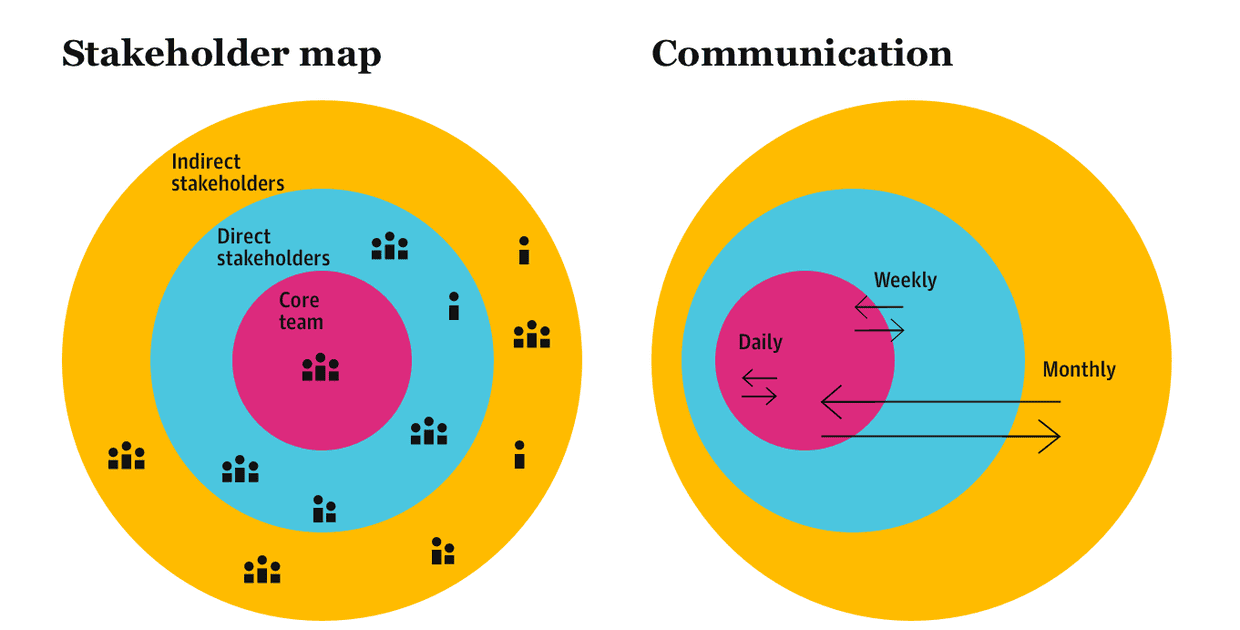
Since communication is key within large organisations, we spent some time creating a communications strategy. This included a stakeholder map, which allowed us to create alignment across all stakeholder via an effective bottom-up and top-down communication stream.
The following diagram helped us to visualise the people and the teams that we wanted to keep constantly informed. It depicts how close the stakeholders are to the core team and the frequency of communications. We used existing stand-ups, recurring fortnightly demos and monthly huddles to optimise the time spent communicating.
3. Audit of current features
Our product is available on two platforms and has different functionalities on each. Some of the features are free, others are available through a sign-in and others are subscription-only.
In order to quickly analyse how distributed the features were, we created a visual map. This provided our team with a tangible sense of the current features. We questioned whether we had a balanced distribution of features and a fair pricing tier. Once we had all the pieces of our current product visually dissected, we were able to begin our formative research.
4. Exploration
First, we listened to what different stakeholders inside the organisation had to say about our product. We did this by conducting several face-to-face individual interviews. This enabled our understanding of operational struggles and expectations from different areas of the business and also strengthened partnerships.
Second, we unpacked existing user research and data insights to consolidate what we already had and make sure we plugged some knowledge gaps. In parallel, we did competitor and trend analysis to look at what other organisations are offering and what tech companies are developing, and to identify predictions for the future.
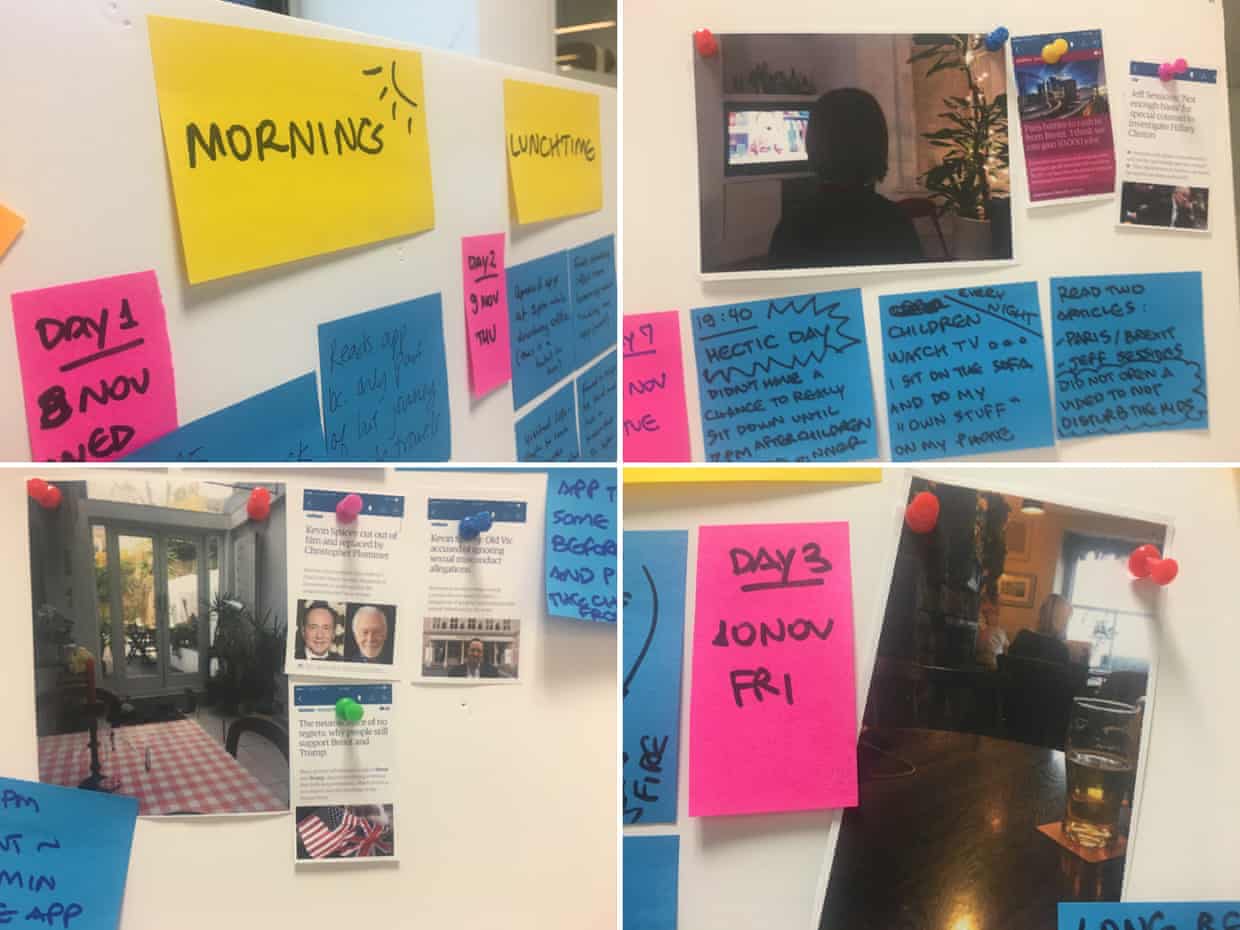
We also started conducting user research, which primarily consisted of a week long diary study. Here we collected qualitative data about the role our product played in the lives of participants, their daily routines and the circumstances involved, including days and times that influenced their habits.
Then we invited the participants to in-depth interviews with a focus on identifying the jobs to be done. During the interviews, it was possible to uncover the reasons why the participants used our product the way they do, and the reasons why they might hire our product for those jobs.
Finally, in order to gain further insights around transactional and emotional behaviours, we implemented a live survey asking people why they decided to pay for our product. The answers provided insights about what users valued and how they perceived our brand compared to others.
5. Sensemaking
After the data collection and analysis, it was time to make sense of it all. This synthesis process was one of the most challenging parts of the whole project. There were times when we felt overwhelmed with the huge amount of information to digest. Nonetheless, we were able to detect meaningful patterns that allowed us to prioritise and visualise our findings in a way that other people would easily understand and absorb.
The collaboration was intense. Focus, flexibility and resilience were key to our process. It wasn’t easy to navigate between walls of stickies, drafts and a dense spreadsheet. Luckily, we found a couple of hours to draw storyboards that brought our data to life; it ended up being a relaxing moment when we were under so much pressure to move onto the next phase.
Once we had defined the jobs to be done and written a list of “how might we …?” questions for each area of opportunity, we diverged our approach again.
6. Idea generation
In this phase, we facilitated four ideation workshops with a diverse range of stakeholders. We structured the workshops with the main activities as follows:
-
Icebreaker
We started the workshop with an exercise to introduce people to the concepts of visual thinking, working memory, mental models and systems thinking. -
Research playback with intermittent brainstorming
We presented findings, areas of opportunities and challenges with short breaks in between to write down ideas individually. -
Clustering of ideas
Working in groups of three to four people, we asked for stakeholders to identify similarities and themes. -
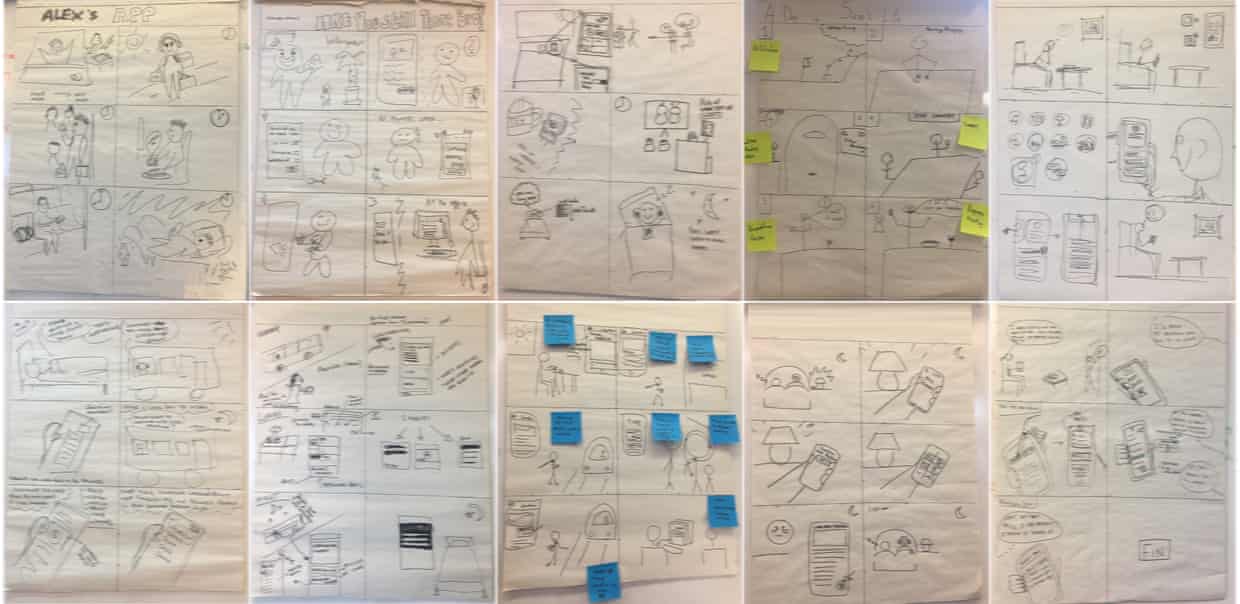
Storyboards
Still working in groups, we asked the stakeholders to draw out story narratives to illustrate how their ideas could help users to fulfil their jobs.
After each workshop, we sent a survey to participants asking for feedback. Overall, the feedback was very positive and most importantly helped us tweak and improve the structure of the following sessions.
7. Prioritisation
After diverging our process for the second time, we ended up with huge numbers of ideas and storyboards to analyse and decide what was worth investing time and effort to prototype and test.
The criteria that we considered included users’ jobs to be done, business and editorial strategy, potential for acquisition and retention, competitive differentiation, platform uniqueness, the technology available, previous insights and data, among others.
Given this wide range of criteria, we realised:
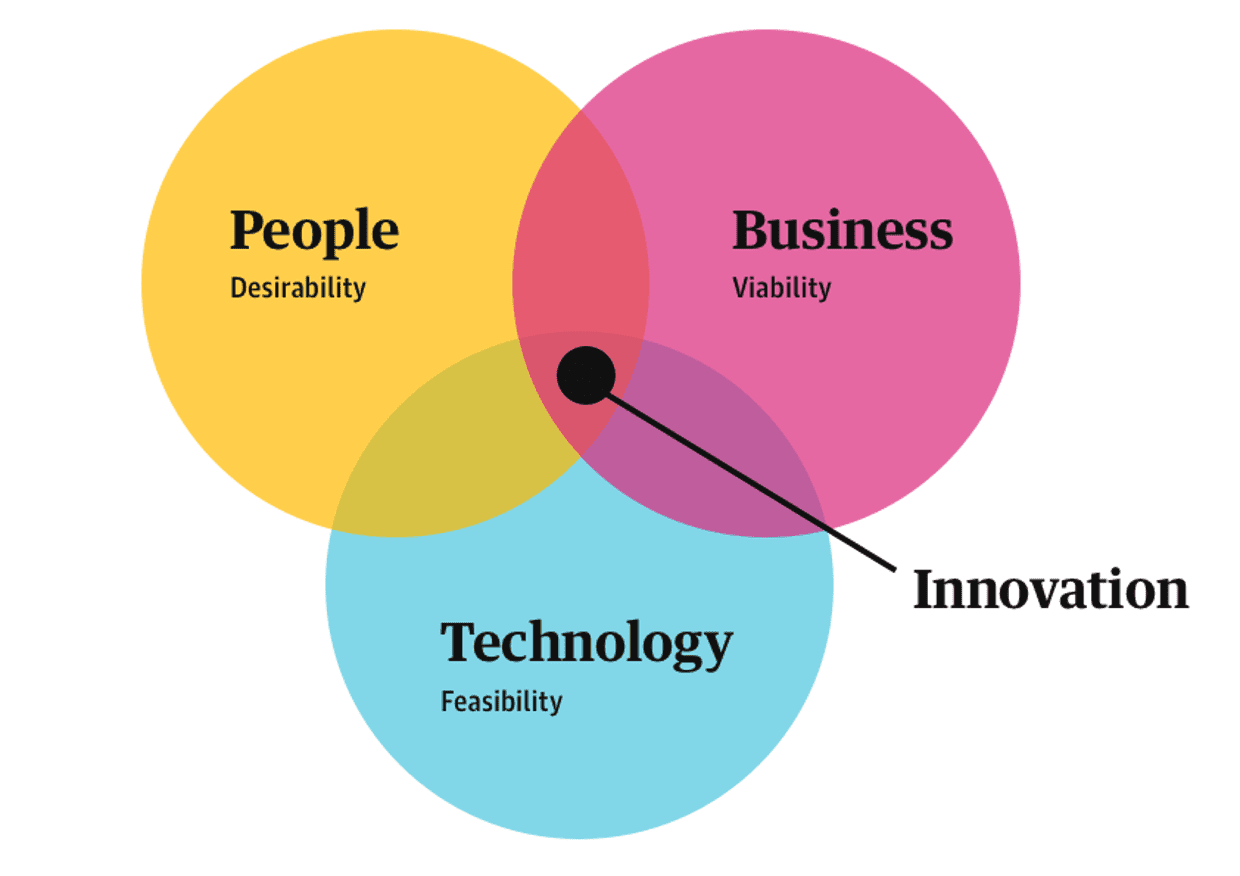
Prioritising ideas is not a linear process; it is a complex matrix of criteria in the triad of people (desirability), business (viability) and technology (feasibility), with the sweet spot at its intersection.
Once we had analysed the groups of ideas through the three lenses above, we defined what we believed would compose premium, satisfiers and basic arrangements of possible features, which naturally led us into the next phase.
8. Prototyping and testing
Working from a list of assumptions, we transformed our ideas into prototypes to test with users. After two days of testing, we felt confident enough to filter our ideas again and decide which prototypes to refine and test once more.
Following this convergence process, the ideas started to take the form of actual features, whereby we were able to assess effort of implementation versus impact to users, as the matrix below illustrates.
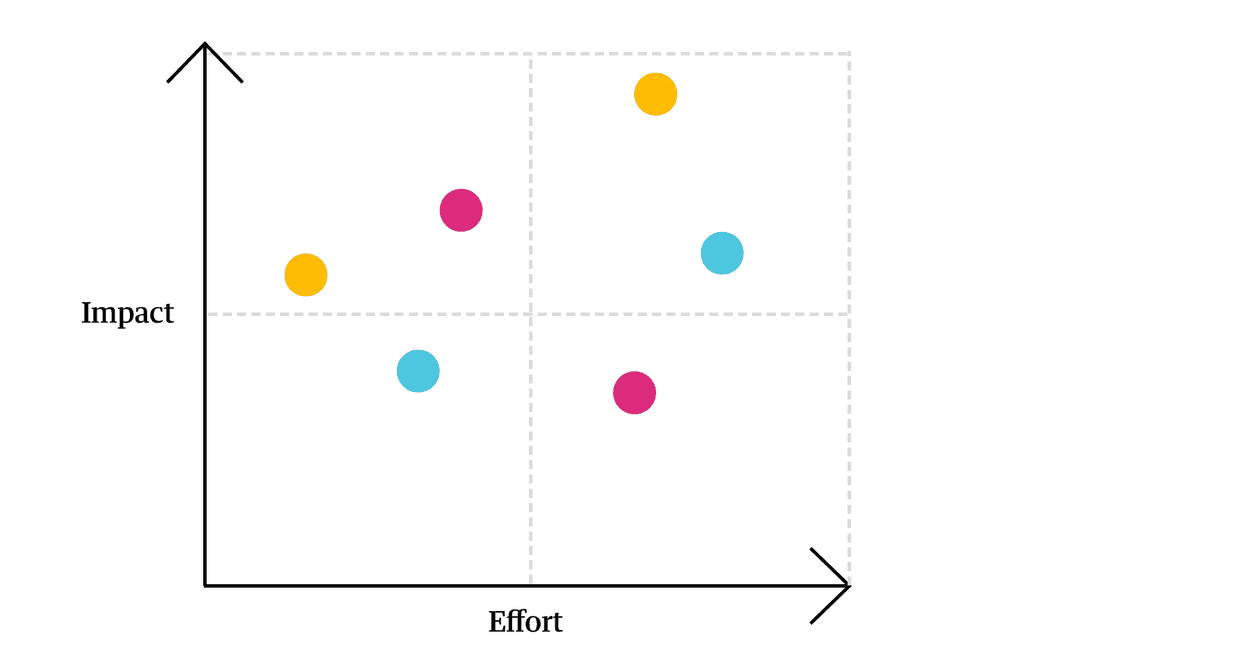
Our next steps will be to revisit our value proposition and test configurations that are aligned with the users’ jobs.
…
Hopefully, this article will help shed light on your projects and navigate through uncertainty. It is worth noting that the process described here is highly flexible and adaptable. According to the amount of existing research available to you, and the size of your team, this process can be stretched or squeezed (à la Google design sprints) with different design methods mixed and matched.
We now not only have a much clearer direction for our value proposition, we have also managed to take our stakeholders on a collaborative journey of discovery. With everybody aligned we can continue to evolve our product in ways that users will love, while helping to sustain long-term business growth.