Over the past few months we’ve been revamping our politics pages in readiness for the 2010 general election. One of the most interesting features has to be the figures representing the swing, marginality and targets of each constituency. It is intriguing how these numbers are calculated and I feel a sense of responsibility to explain what they mean, where they are from and why ours are different.
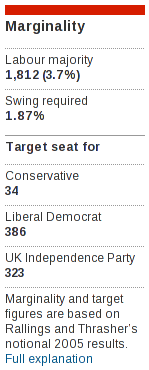
If you were to type your postcode into the “Find your constituency” search box on the politics front, the resulting page will show a column of marginality date like the one displayed here. This example is from Dorset South.
The citation that appears at the bottom of this column relates to Rallings and Thrasher at the University of Plymouth who have taken the results for the 2005 general election and applied them to the redrawn constituencies of 2010. The purpose is to give a rough idea of how today’s constituencies would look if everyone voted in exactly the same way as they did in 2005. Details of how constituency boundaries are redrawn can be found on this page.
In this hypothetical situation for Dorset South the Labour party would have a slim majority of 1,812 votes. If the Conservatives were to steal just 1.87% of the votes directly from Labour, they’d win the seat. This is swing in a nutshell; the percentage of votes required for a party to lose their seat to the next most popular party. This number appears underneath the heading ‘Swing required’.
Beneath the swing percentage are the party targets. In principle, targets are calculated by working out the swing needed by each party to win in each constituency and then ranking them in order. In our example, Dorset South is the 34th target for the Conservative party which means that there are 33 other constituencies where the Conservatives need fewer votes in order to win. It’s the calculation of these targets where the Guardian differs from Rallings and Thrasher.
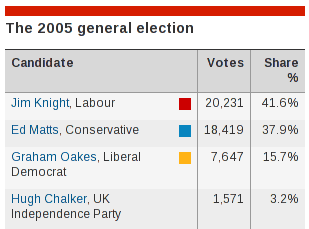
The accepted fashion of calculating swing always seems to involve stealing votes from the first party. But in the example of Dorset South (see the table titled “2005 general election results for Dorset South” above), if the Liberal Democrats were to steal votes from Labour until they were ahead of them, the Conservatives would win. The Liberal Democrats need to steal votes from both Labour and the Conservatives to have a chance of winning. So that’s what we did. When calculating the swing for the Liberal Democrats in Dorset South we stole votes from both Labour and the Conservatives. And for the UK Independence Party, we stole votes from the Liberal Democrats, the Conservatives and Labour. And so on. And then we applied this formula to all of the parties in all the other constituencies.
The question we kept asking ourselves was, what is the fewest number of votes needed by party x in order to win in any given constituency? And we feel that our calculation answers that question accurately.
So how much should we rely upon swing, marginality and targets to give us an indication of how easy it would be for a party to steal a constituency in the next election? If we look back at how we arrived at these figures we see that we’ve already had to accept a hand full of hypothetical situations. Not only have we replayed an election from 5 years ago against modified constituencies, we’ve also made assumptions that Liberal Democrat voters may swing their vote to other parties and vice versa. However, these figures do provide an insight into how close this contest could be, as well as indicating which constituencies are the most hotly contested.
Over the next few weeks we’ll all be bombarded with ever more elaborate ways of representing swing, marginality and targets. Each of which may vary slightly according to how they are calculated. I suppose the most important question is what story are they trying to tell us?
All of this data is available through our politics API.