There’s a lot of argument about what people should be doing to cut carbon emissions. We want to present the data behind the arguments in an accessible way and encourage people to make their own decisions.
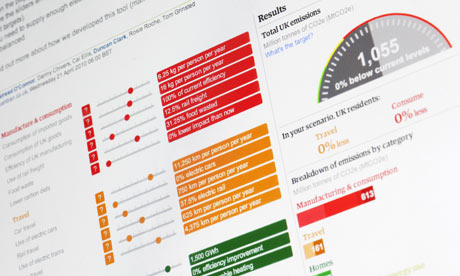
We launched our personal carbon calculator last year, but it’s clear that many sources of carbon emissions are beyond the control of an individual. Some of the decisions about lowering our impact must be taken on a national level. So we’ve developed a tool which attempts to model where the UK’s carbon emissions come from. We encourage the user to play the role of the UK prime minister to explore different scenarios of how we could change consumption, travel, power generation and other sectors of the economy.
We began developing this product when Danny Chivers approached Duncan Clark and myself with a demo for a model of the UK economy’s carbon impact. We loved the idea, and formed to team to turn it into a working application. I led the product development and the data modelling. Danny selected and collated all of the data, and worked with Duncan on the labelling and help text. The Guardian Digital Agency led the design and development of the Flash application.
My goal in developing this product was to balance accuracy and usability. I wanted it to be accessible to people without a lot of knowledge around carbon emissions, but to be detailed enough to be useful to those who follow these issues closely. Above all I wanted to move the debate beyond simplistic “flying = bad; electric cars = good” arguments. There are many factors affecting how much CO2 the UK is responsible for, including several (carbon capture and storage, for one) that we’ve chosen not to cover in this model, but we think this is a good representation of the most important areas.
There have been approximations made. For example, power plants come in different sizes and formats. They also tend not to run 24 hours a day. For the sake of simplicity, we’ve calculated an average figure for each type of electricity generation based upon the number of plants we have now and the amounts of electricity and CO2 they currently produce.
It was difficult to decide what ranges the sliders for each category should go to. I tried to allow the user to set most sliders to as close to zero as possible so that they can imagine a “minimalist” carbon economy. Setting upper limits was harder - how many wind turbines can feasibly be built? How much more efficient can we make our homes and public buildings? I’ve set the limits quite high, but I’d be interested to hear if you think they should be different.
This has been a more challenging project data-modelling project than anything I’ve tackled before. I’ve tried my best to include as much detail as possible in the application, but if you’d like to know more, or to investigate the sources of data, look at our underlying spreadsheet model. There will be some errors and ambiguities - please do leave a comment, message us on Twitter, or share your thoughts on our Facebook page if you’d like to highlight an area for improvement.
Update 5th May 2010
The model was amended to fix some double counting errors in the application.
Download the data
• DATA: download the full datasheet
Can you do something with this data?
Flickr Please post your visualisations and mash-ups on our Flickr group or mail us at datastore@guardian.co.uk